
What Really Drives Housing Prices?
Over the weekend, Scott Alexander wrote a post titled "Change My Mind: Density Increases Local But Decreases Global Prices."
In his post, Alexander highlights a real (if misleading) correlation between urban density and housing prices.
The two densest US cities, i.e., the cities with the greatest housing supply per square kilometer, are New York City and San Francisco. These are also the 1st and 3rd most expensive cities in the US... So empirically, as you move along the density spectrum from the empty North Dakota plain to Manhattan, housing prices go up.
He goes on to argue that more people prefer to live in big cities than there are available housing units. Given the housing shortage in major cities, this supply/demand mismatch is fairly evident.
However, he goes further to suggest that this preference for density is what's driving demand.
For example, if my home city of Oakland (population 500,000) became ten times denser, it would build 4.5 million new units and end up about as dense as Manhattan or London. But Manhattan and London have the highest house prices in their respective countries, primarily because of their density and the opportunities density provides.
If any given city were to build more housing and grow, he reasons, it would become more desirable to a mobile subset of Americans that want to live in big, dense cities—and thus more expensive. The global supply of housing would increase (thus decreasing global prices) but the city in which new housing was built would become proportionally more attractive, offsetting any local benefits to affordability. This is how Alexander explains the correlation between density and housing prices.

Pictured: Lots of housing. Not pictured: Lots of high paying jobs.
There's something to Alexander's argument. My own research at UC Berkeley found that there is indeed a price premium for housing in dense, walkable neighborhoods relative to metro-wide median property values. At the neighborhood-level, people do prefer density! However, when we're talking about differences in housing costs across metros, these effects are marginal at best.
I appreciate Alexander's epistemic humility on the subject ("Tell me why I'm wrong!") so I'll take him up on the request. I suspect his argument is derived from a common saliency bias. People see dense housing all around them in expensive cities and believe there must be a causal relationship. Fortunately, we can use data to help us overcome these biases.
To the data!
Looking at 2017-2021 ACS data for all American Core-Based Statistical Areas (CBSAs), we can see there is indeed some correlative relationship between density and housing values, but it’s not particularly strong.

Alexander has the causal relationship backwards. Money doesn't follow housing; housing follows money. The money used to bid on housing has to come from somewhere...
Yes, the critical missing piece to Alexander's analysis is jobs. The North Dakota plains aren't just lacking housing; they're lacking jobs. If lots of high-paying jobs were to appear, the income they generate would flow into housing. If the supply of housing were limited, its value would increase.
In fact, this is exactly what happened in North Dakota during the Bakken Formation oil boom of the 2010s. Oil workers who traveled to reap the benefits of expanded oil production arrived to discover houses and apartments renting for $3,000 a month. Many found themselves living in trailers.

Fox Run RV park in Williston, North Dakota, 2015 | Photo by Andrew Cullen / Inside Energy
While housing prices are the result of many factors, there are three main drivers:
The number of available jobs
The salaries of those jobs
The amount of housing available for those workers
For the purpose of demonstrating this relationship, we can combine variables #1 and #2 into aggregate income, which is the total income from all jobs in a metropolitan area. As expected, aggregate income and total housing supply are closely correlated.

That isn’t a very user-friendly chart so here’s an interactive version that lets you zoom in.
Metros above the fitted line have either a lot of jobs or higher-paying jobs relative to the number of housing units available. On this side of the line, we find San Jose, San Francisco, and Washington DC.
Metros below the fitted line have a lot of housing relative to their aggregate income. On this side, we find Detroit, Tampa, and Phoenix.
There’s already a pattern emerging here, but let’s make it clearer.
If we turn these two metrics into a single ratio — aggregate income per unit of housing — we can plot that against median home values.

What we find is a significantly stronger correlation! Aggregate income per unit of housing predicts approximately 56% of the variation in median values at the metro level. We now have an explanation for why San Jose is more expensive than San Francisco despite having lower housing density (one might say it's because of its lower housing density).
Meanwhile, our outliers are exceptions that prove the rule.
Places like Key West, FL, Kahului, HI, and Ocean City, NJ have high property values relative to their aggregate incomes per unit of housing because the income that drives those values up comes from jobs in other places—these are vacation home markets.
On the other side, we have places with low property values relative to aggregate income per unit of housing. Los Alamos, NM, stands out here. Los Alamos is effectively a company town for Los Alamos National Laboratory (where the atomic bomb was invented during WWII). According to their website, Los Alamos National Laboratory employs 14,150 people. The population of Los Alamos is just shy of 13,000 (some commute from nearby Santa Fe). These are high-paying jobs, but given that there's only one employer in town, the pool of potential buyers is very small, and thus property values are unusually low.

Los Alamos: Where Discoveries Are Made! (Unless you want to discover a buyer for your home when Los Alamos National Laboratory isn’t hiring).
Let’s set these outliers aside by running the data one more time but only including metros with a population larger than 1 million.

Sure enough, the relationship gets even stronger! An r-value of 0.9 suggests that over 81% of median home values in large metros can be attributed to aggregate income per unit of housing.
Change Over Time
OK, comparing metros to one another clarifies the importance of jobs and housing supply in outcomes between regions, but what we really want to know is whether building more housing in a given metro (above and beyond job and wage growth) would lower the cost of housing.
Unfortunately, that didn't happen in any major metro in the last decade, so we don't have a great case study (yes, this is why every city is becoming unaffordable). But we can see that there's a strong relationship between the change in aggregate income per unit of housing and the change in median property value over time, just as there is across cities for a given period of time.

This model is even stronger for predicting changes in rents; 74% of these changes can be explained by changes in aggregate income per unit of housing.

For a far more rigorous analysis of this relationship within a single city over time, please refer to Erica Fischer’s brilliant work collecting and analyzing 30 years of for-rent ads in San Francisco:
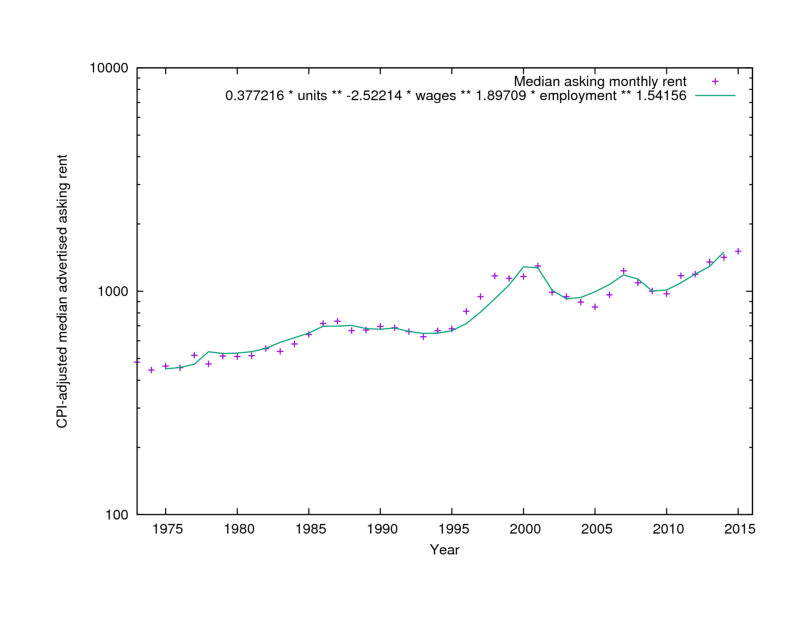
Green Line: # of units, wages, and #of jobs | Purple Stars: median rent in San Francisco
While it might help reduce the cost of housing, I don't suspect anyone wants aggregate income in their city to fall. Affordable as they may be, the story of cities like Detroit and St. Louis is not a happy one.
That leaves us with one big lever: housing supply. The only real way to reduce housing costs is to build more housing for that aggregate income to flow into.
"Build more housing" isn't a singular policy, but a coherent suite of policies that begins to address the challenge on a variety of regulatory fronts. That suite includes eliminating single-family zoning (as recently enacted in Minneapolis and Portland), abolishing parking minimums, and updating building codes to allow more efficient use of floor plates with single-stair apartment buildings. It may also involve experimentation with land value tax as a method to incentivize development and reduce land speculation. Less obvious factors like immigration policy play a role in construction costs.
Perhaps most centrally, the "Build more housing" policy suite must include reforms that address the vetocracy that governs housing development in the United States, which co-opts environmental review and community oversight mechanisms to ensure that very little gets built in American cities. As Jerusalem Demsas aptly writes, our communities have become "like a homeowners' association from hell, backed by the force of the law."
How did it get so bad? As a former city planner, it pains me to acknowledge that upstream of this crisis we find the planning profession’s active abdication of power following the reckoning of mid-century urban renewal. As Thomas Campanella wrote in Places Journal, “Planning in America has been reduced to smallness and timidity, and largely by its own hand.” Addressing the housing crisis will require planners to step up as the adults in the room, becoming a muscular-yet-accountable force for the greater good rather than stewards of homeowner selfishness.
There’s no reason we can’t have wealthy and affordable cities. We just have to increase the denominator of aggregate income per household.

Let’s return to Alexander.
I don't see why Oakland being able to tell a different story of how it reached Manhattan/London density levels ("it was because we were YIMBYs and deliberately cultivated density to lower prices") would make the end result any different from the real Manhattan or London.
In fact, the YIMBY story would make a world of difference in the end result! The story of Manhattan and London is one of housing supply lagging behind a dramatic growth of high-paying jobs. Their housing densities mask an even greater density of jobs. When jobs boom, it can be hard for housing supply to keep up, but it’s not impossible. A story in which housing supply keeps up with job growth creates a housing market more like that of Tokyo.
Alexander's argument overlooks the critical role of jobs and income in the housing price equation. The data shows us that it's largely the ratio of aggregate income to housing supply that’s really driving housing prices. The key to our affordability crisis is ensuring that housing supply keeps up with local job markets.
Scott Alexander, I hope I've changed your mind.
Notes
You may be surprised to see New York’s relatively moderate home values. At first I thought this may be due to data collection during the pandemic, but I checked the 2007-2011 and 2012-2016 ACS data and it looks basically the same. I suspect this is due to some combination of the New York CBSA boundaries being enormous (see below) and perhaps New York homes being very small.
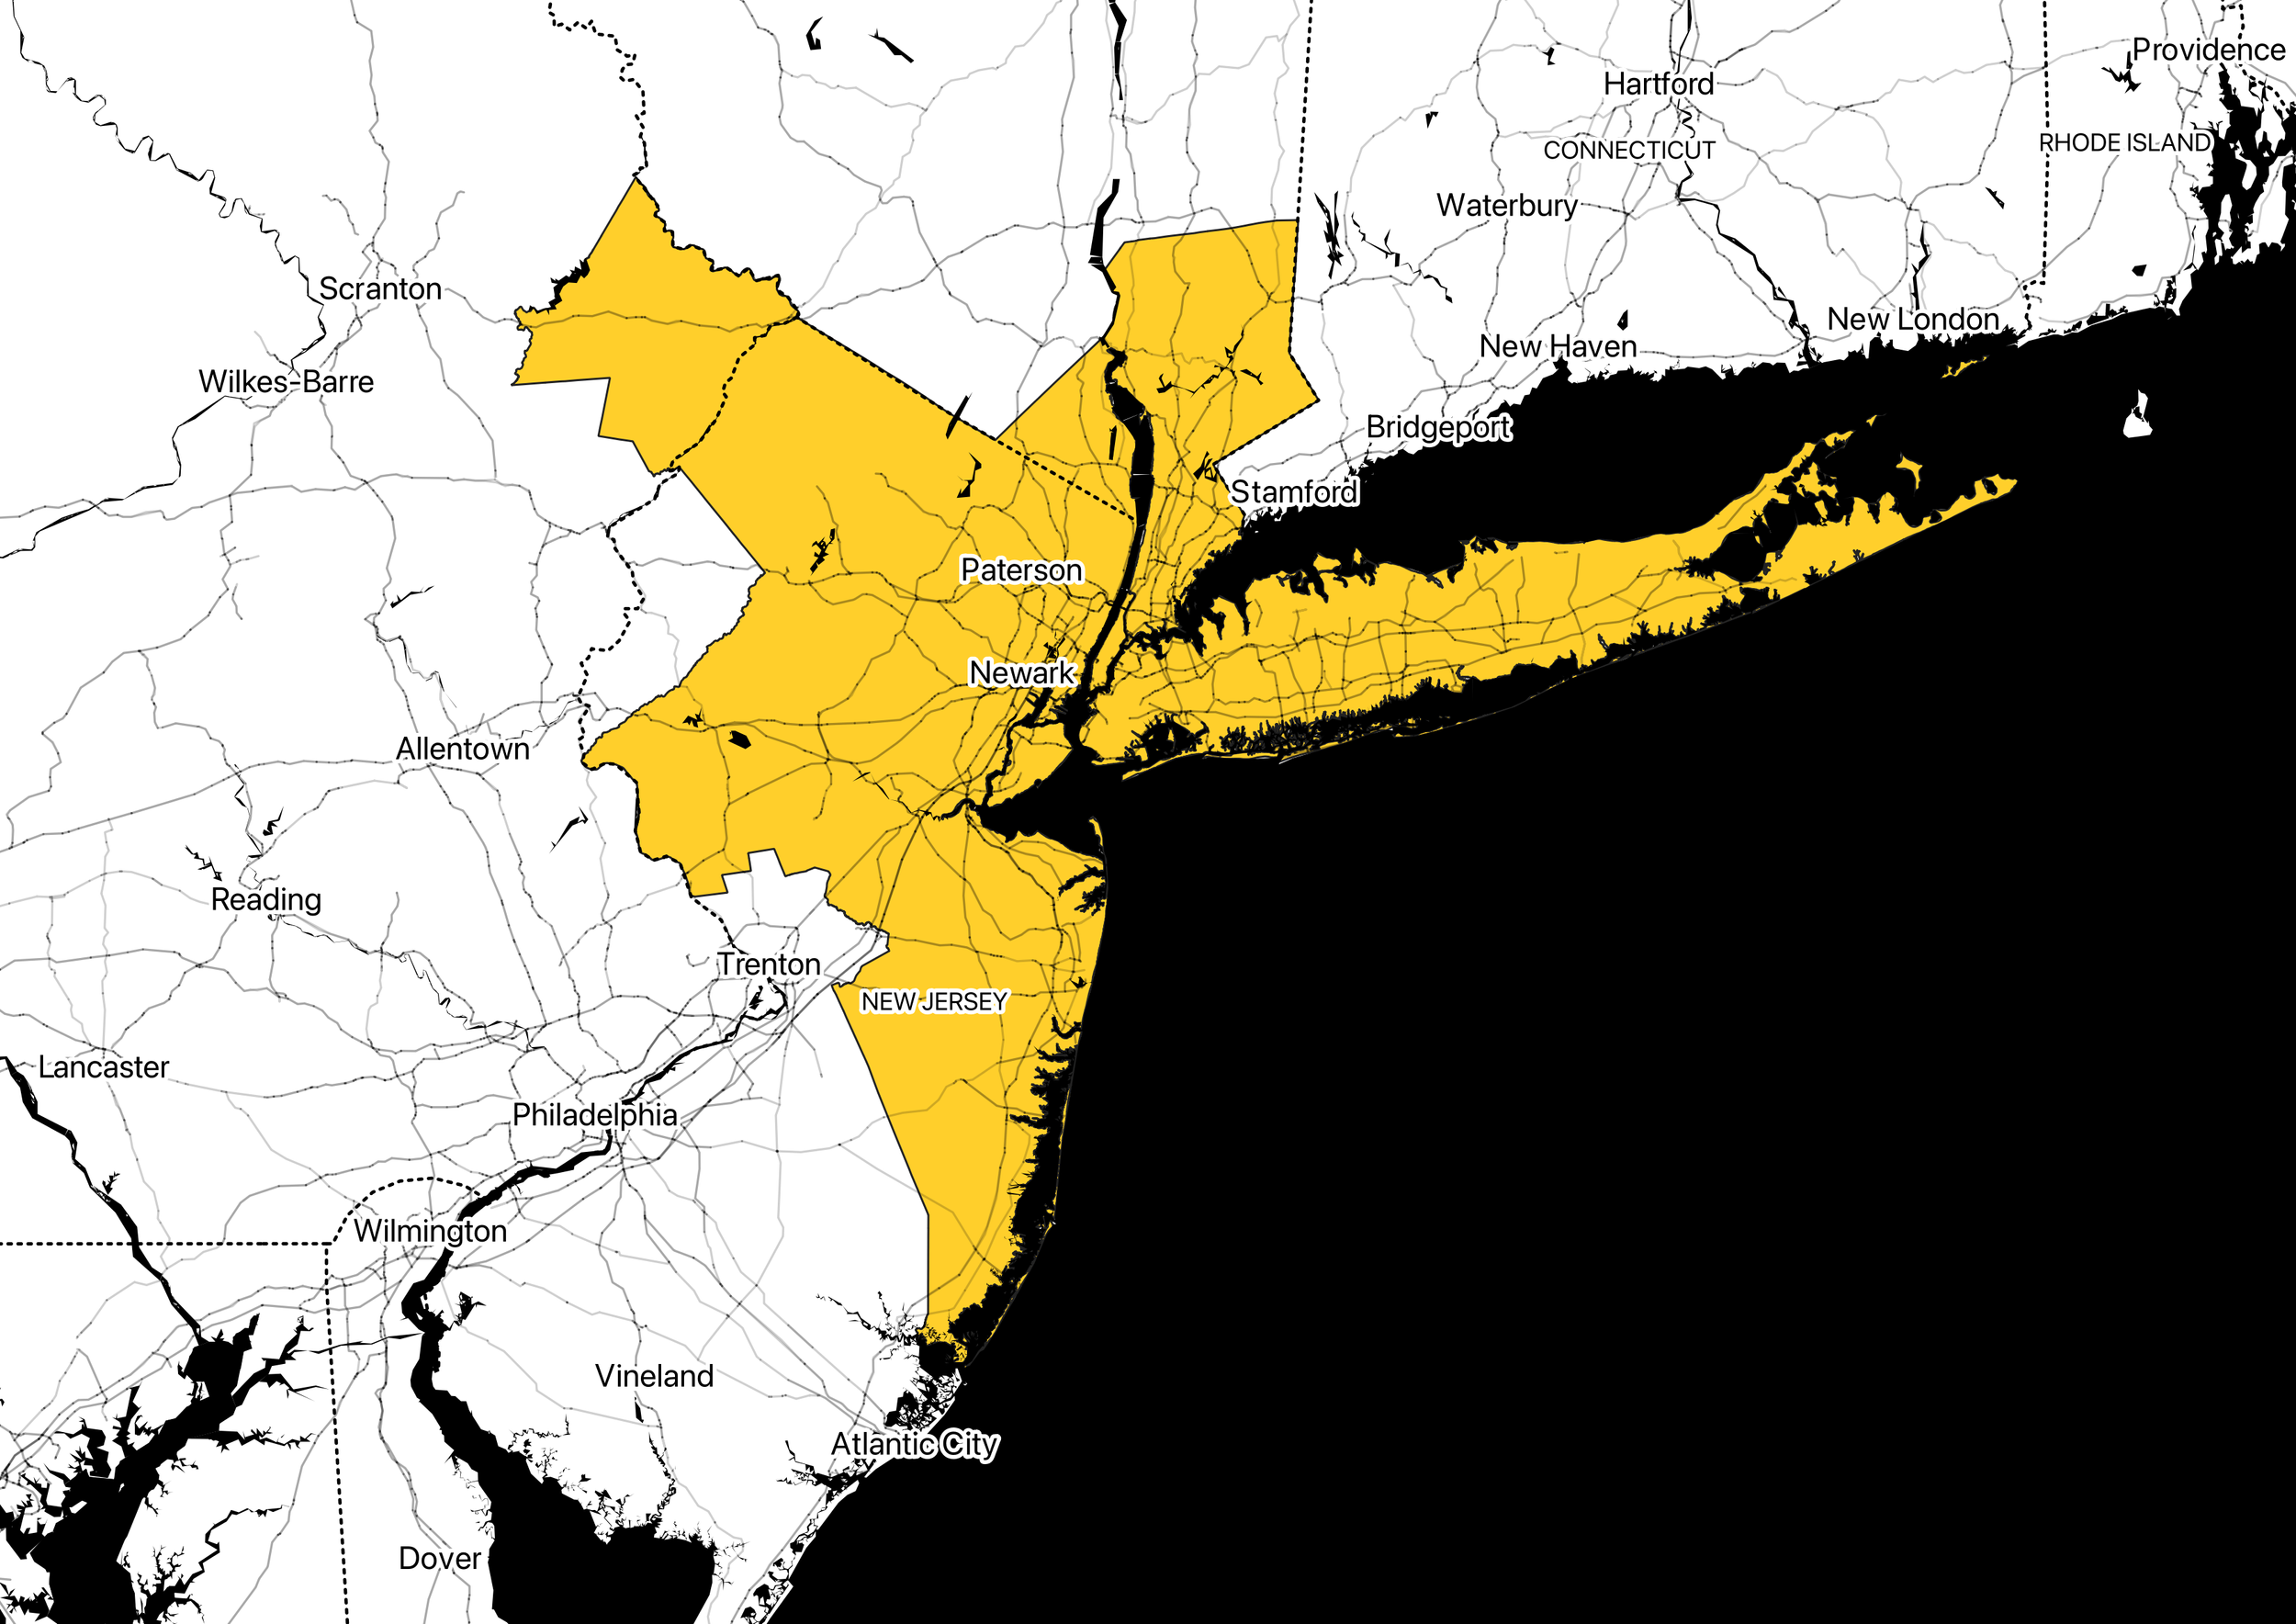
New York CBSA boundary