MothBabyDiv.jpg

Notes

A Policy Alchemy for the Housing Crisis


Two horses yoked together can pull not twice, but four times the weight that either could alone. The combination of their strength is multiplicative; the whole is greater than the sum of its parts. In a similar way I believe we can produce more affordable housing in American cities by combining two policies than the sum of what either policy would produce on its own. Let’s call it Inclusionary Abundance.

In housing policy circles, “affordable housing” doesn’t have a universal definition. To one camp, “affordable housing” refers to housing that has been publicly subsidized or required by law to be made available at sub-market rate prices. To another camp, “affordable housing” is a shorthand for market-rate housing that has been made accessible by increasing the supply of housing.

Inclusionary Abundance is a special housing policy alchemy that (theoretically) creates more of both kinds of affordable housing by strategically fusing two policies. The first policy is a common regulatory solution; inclusionary zoning. The second is a market-based solution found elsewhere in the world but rare in the United States; land value tax. There’s good reason to believe we’d see a special interaction effect that happens when you enact both of these policies together.

What is Inclusionary Zoning?

New York, Boston, San Francisco, Portland, Denver, and many other major US cities have some form of inclusionary zoning. While the details vary widely, inclusionary zoning generally enforces the following rules on real estate developers: For multifamily housing developments above a minimum project size (usually expressed in # of units), a minimum percentage of “set-aside” units must be made affordable (meaning the renter or homeowner spends no more than 30% of their income on housing) at prices relative to a percentage of area median income (AMI).

Consider a hypothetical city with a median income of $100,000. Its inclusionary zoning policy kicks in for multifamily developments larger than 6 units, and requires that 20% of units be made affordable at 60% AMI (meaning someone with an income of $60,000 would need to spend no more than 30% of their income).

If a developer in this city wants to build a 10-unit rental building, then 2 units must be rented at $1,500/mo to qualified renters (since $60k AMI is $5k in income a month, and 30% of $5k is $1,500). The remaining units can be leased at market rates.

In practice there are plenty of other complexities, but these are the basics of how inclusionary zoning works.

What’s the problem with Inclusionary Zoning?

Let’s revisit our horse metaphor. Setting the parameters of inclusionary zoning policy is like packing a horse’s wagon to cross a long trade route. We want to pack as much as the horse can pull, but if we pack an ounce too much, we risk overburdening the horse and having it collapse. If it collapses, we don’t get anything to our destination.

We’d better be really confident about whether the horses can handle that last bag.

We can think of real estate developers as our horses, and affordable housing units as the packages we’re loading on their backs. If we require too many affordable housing units, the cost of development is too high relative to expected returns and we get no housing at all—affordable or otherwise!

What numbers “pencil” for housing developers will vary widely from city to city depending on factors like land prices, construction costs, and market demand. Debates over the extra “burden” of affordable housing requirements and how to get the most housing possible recently led San Francisco to cut their inclusionary zoning requirements roughly in half, from 21.5% to 12% of rental units. If this cut induces more housing development, it’s possible that it will result in a total increase of affordable housing units (in the regulatory sense of the term) even though the required percentage is lower.

Inclusionary zoning risks backfiring on us. If the percentage of affordable units required is too high (i.e. real estate developer’s projects no longer pencil) we end up with even less housing than we would otherwise.

What is Land Value Tax?

The term ‘land value tax’ is generally used to describe a revenue-neutral shift in property tax from the total value of real estate to a tax on only the land value of the property. Wonky, right? Here’s why it matters.

In the US, property tax is applied to the total value of real estate (land value + “improvements” which are usually buildings). This has a couple downstream effects.

First, our property tax structure makes it possible to make lots of money by purchasing valuable urban land and keeping it vacant. Since there’s no improvements, the tax bill on a vacant lot is low. As long as others are developing nearby and increasing the value of the vacant lot, a land speculator can make a handsome profit by holding the lot ransom until its market value covers the tax bill and returns the profit margin they want. All of this happens without the land speculator ever lifting a finger.

Henry George first proposed a land value tax in his book Progress and Poverty (1879).

Second, our property tax structure reduces the supply of housing. In some cases this is due to speculators taking buildable urban land off the market. In other cases, the tax bill that would be incurred by building the maximum number of possible units incentivizes developers to build less efficiently than they otherwise would. The current property tax structure doesn’t just encourage land speculation, it encourages underdevelopment. It also contributes to sprawl, as housing developers must leapfrog speculators in search of cheaper land further from the city center.

What happens when you shift property tax from buildings to land?

Let’s imagine a city where the property tax is 1%, applied to the total value of a real estate asset so that a $1M property pays $10k in taxes each year. That city decides to implement a revenue-neutral land value tax, shifting all of the tax burden from buildings to land while keeping the city’s total property tax revenue the same. Since the assessed value of all buildings in the city is 4x the assessed value of all land (this is fairly typical), the tax rate on land is increased to 5% while the tax on improvements is removed completely.

With this backdrop, let’s imagine two properties side by side. One is a small apartment building, the other is a vacant lot. Since they are the same size and location, their land values are the same: $200k. The assessed value of the apartment building, however, is $800k, so the total value of the property (land + improvements) is $1M, while the vacant lot’s total value is $200k.

Under the 1% property tax on both land and improvements, the apartment building paid $10k per year in property taxes while the vacant lot pays only $2k per year. The vacant lot owner doesn’t mind because he knows the value of his land is appreciating at a rate higher than $2k per year (and/or perhaps he’s making enough revenue to cover that cost by renting it out as car parking).

When we institute a 5% land value tax and remove the tax on improvements, the small apartment building pays the exact same $10k per year, since 5% of its $200k land value is $10k. (Elsewhere in town, a large apartment building on a lot with the same value pays less in taxes than it did previously).

What happens to the vacant lot? Instead of $2k in property taxes, it now pays $10k as well. Holding this lot vacant just became very expensive!

In order to cover this increased holding cost, the owner must develop the lot or sell it to someone who will. This will increase the supply of housing and put downward pressure on market-rate housing costs.

We’ve seen this effect play out in natural experiments. In the three-year period after Pittsburgh increased its tax rate on land to 5 times the rate on improvements in 1979, building construction permits in the city increased 293% compared to the national average.

Inclusionary Abundance: Combining Land Value Tax with Inclusionary Zoning

We’ve now seen how inclusionary zoning can create affordable housing in the regulatory sense (as long as the required percentage of affordable units isn’t too high). We’ve also reviewed how land value tax can create affordable housing in the market-rate sense by creating incentives to build more housing, thereby increasing supply relative to demand. But the real magic happens when we combine these two policies together to form Inclusionary Abundance.

Recall the vacant land owner whose tax bill just went up thanks to a revenue-neutral shift to land value tax. He’s probably not a developer (otherwise he would have developed it!) so he needs to sell that land to a developer who is going to build housing on it.

But he isn’t the only one. Across the city, vacant and underdeveloped land owners are now looking to offload their property, because it’s too expensive to hold it now that property taxes are falling entirely on the value of land. Land that was previously locked up in speculation floods the market.

What does that increased supply do to the price of land? Naturally, land gets cheaper to buy.

Land is an expensive part of the real estate developer’s costs. It can range from 10% to 20% of overall development costs and even higher in major urban areas where the housing crisis is most severe—in San Francisco land accounts for about 60% of total property values!

Here’s the trick of Inclusionary Abundance. By reducing land acquisition costs for developers using land value tax, we can safely increase the percentage of affordable housing units required by inclusionary zoning without discouraging housing development. We’re effectively taking those land cost savings and—rather than padding developers’ profits—allocating them to below-market rate affordable housing. Land value tax reduces market rate housing prices on its own, but it also allows us to increase the supply of below market rate housing at the same time. In this way, we create more affordable housing of both market rate and below-market rate varieties.

This sets in motion a virtuous cycle. As more development happens, the value of land goes up. As the value of land goes up, it incurs higher taxes and thus pressure for even more development. Building by building, the market rate price of housing comes down and even more sub-market rate housing units become available.

There is a spatial component to this cycle as well. At first, most development pressure would fall on vacant and underdeveloped land in the urban center where land values are highest. As this central land gets developed, land on the urban periphery becomes more valuable and therefore incurs higher taxes, incentivizing the next round of land selloffs, downward pressure on those land prices, and development in inner ring suburbs. As this process continues, the city begins to take on a more compact form with much more housing. This compactness has several unexpected benefits in addition to alleviating housing prices.

Copenhagen has a land value tax, Indianapolis does not. This policy difference influences urban form, encouraging more housing on less land.

Just how much could we increase inclusionary zoning requirements? It would vary by metro depending on how far land prices fall (we could even imagine a mechanism by which inclusionary zoning requirements are inversely pegged to land prices), but it could be significant. New York City has over 77,000 privately-owned vacant lots that we might expect to enter the marketplace fairly quickly. Austin has over 17,500. It would also depend on the tax rate set on land, as economists have determined that the price of land would fall as the tax on land increases.

Of course, no American city has ever seen a land value tax paired with inclusionary zoning. We don’t know exactly how Inclusionary Abundance would play out, but that doesn’t mean we shouldn’t try it.

Kasey KlimesComment
The Urban Form of Loneliness: Why America Needs Villages

Photograph by my mother, 1982.

This is the village in Germany where my parents met in the 1980s. It is called Imsbach, population: 971. The longest walk you can take while staying in the village is 15 minutes.


I grew up visiting Imsbach. Except for the wind turbines that went up (and created some new jobs), it never really changed.

The edges of the village are well-defined. You are inside the village, or you are outside the village. There is no in-between.


The center of the village serves as a meeting place for any and all community gatherings, formal and informal. Everyone knows everyone. It's a very difficult place to feel lonely.

Imsbach sits at the base of a large foothill. In the summer, we would all climb up and drink Bischoff (the local beer) together at a community space the town built at the top, and enjoy the view. This was where I had beer for the first time.


Imsbach is lovely, but it isn't special. There are hundreds of villages like this across Germany, and tens of thousands more across the rest of Europe, Latin America, Africa, and Asia.

Nanhua Miao Village, China (Population: 824)

Pucara, Bolivia (Population: 795)

Tiebele, Burkina Faso (Population: 300)

Hallstatt, Austria (Population: 859)

Ainokura Village, Japan (Population: 90)

Piodão, Portugal (Population: 224)

Yet, back in the US, there is nothing of the sort. I’ve spent years looking for an “American village” with comparable population size and density to any of these examples, and have yet to find one.

Instead, the vast majority of the United States provides two options:

America doesn't have villages. A village is small and dense. Imsbach is only 971 people, but they live close together — about 11 people per acre, a population density you will only find in the urban neighborhoods of very large cities in the US.

America has small towns—but they aren't dense. It has dense cities, but they are anything but small.

Why does this matter? Because America is deep in a crisis of loneliness, and the form of our communities is a critical determinant of social connectedness. Low density permits few opportunities to connect. Sure enough, suicide rates are higher in low-density suburbs.

On the other hand, massive cities contribute to a sense of anonymity and social isolation of a different kind. As President of the National Federation for Mental Health of the Netherlands, Dr. Arie Querido, once wrote,

The greatest danger—I would almost say the greatest crime—of modern city life is its disruption of human relations, resulting in an isolation, a loneliness of the individual which increases with the size of the city and its complexity.

The problem is growing dire. Since 1985, social scientists have asked a representative sample of Americans, "How many confidants do you have?" In 1985, the most common answer was three. By 2004, the most common answer was zero.

As our pandemic experience reminded us, our species does not handle isolation well. Humans are a social species. We aren't adapted to endure isolation, just as fish aren't adapted to live out of water. Research shows that isolated individuals are twice as likely to die prematurely as those with more robust social interactions.

So why doesn't the US have villages? This question is way too large to tackle here. Suffice it to say, American communities were built in a different era, under a different logic, and governed by different rules. For more on the subject I highly recommend James Howard Kunstler’s Geography of Nowhere.


Could we build American villages? We've surely achieved far more difficult things, but what would it take? I'm jumping off into speculation now, but a few things come to mind for me as opportunities...

For one, macro-level spatial forms are generally downstream of economic forces. It's easy to figure that the loss of small-scale farming and corporate consolidation of industry makes the economic viability of villages impossible...

But the residents of Imsbach are not craftsmen producing furniture by hand in little workshops. Our closest friends work at the multinational corporation BASF in Mannheim, 45 minutes away by car. Others work in finance in Frankfurt or at universities in Kaiserslautern.

By contrast, consider where you end up if you drive 45 minutes in any direction from any major employment center in America:

The US economy is not so fundamentally different from the German economy. What's different is that German cities (like German villages) have clearly defined boundaries distinguishing them from the countryside. It is therefore easy to live in a village and commute to the city.

Look closely at the peripheries of these two cities. What do you notice?

Because of sprawl, an American village would need to be much farther from employment centers (and the basic goods and services that only major metros can sustain) than its international counterparts. This creates an obvious hurdle.

Of course, the rise of remote work, sophisticated shipping logistics infrastructure, tele-medicine, cheap solar energy, and digital technology as a whole present a new opportunity for the American village.

These are the conditions that might sustain an American village, but they aren't the force needed to catalyze American villages into existence. That will take something greater.


Kasey KlimesComment
What Really Drives Housing Prices?

Over the weekend, Scott Alexander wrote a post titled "Change My Mind: Density Increases Local But Decreases Global Prices."

In his post, Alexander highlights a real (if misleading) correlation between urban density and housing prices.

The two densest US cities, i.e., the cities with the greatest housing supply per square kilometer, are New York City and San Francisco. These are also the 1st and 3rd most expensive cities in the US... So empirically, as you move along the density spectrum from the empty North Dakota plain to Manhattan, housing prices go up.

He goes on to argue that more people prefer to live in big cities than there are available housing units. Given the housing shortage in major cities, this supply/demand mismatch is fairly evident.

However, he goes further to suggest that this preference for density is what's driving demand.

For example, if my home city of Oakland (population 500,000) became ten times denser, it would build 4.5 million new units and end up about as dense as Manhattan or London. But Manhattan and London have the highest house prices in their respective countries, primarily because of their density and the opportunities density provides.

If any given city were to build more housing and grow, he reasons, it would become more desirable to a mobile subset of Americans that want to live in big, dense cities—and thus more expensive. The global supply of housing would increase (thus decreasing global prices) but the city in which new housing was built would become proportionally more attractive, offsetting any local benefits to affordability. This is how Alexander explains the correlation between density and housing prices.

Pictured: Lots of housing. Not pictured: Lots of high paying jobs.

There's something to Alexander's argument. My own research at UC Berkeley found that there is indeed a price premium for housing in dense, walkable neighborhoods relative to metro-wide median property values. At the neighborhood-level, people do prefer density! However, when we're talking about differences in housing costs across metros, these effects are marginal at best.

I appreciate Alexander's epistemic humility on the subject ("Tell me why I'm wrong!") so I'll take him up on the request. I suspect his argument is derived from a common saliency bias. People see dense housing all around them in expensive cities and believe there must be a causal relationship. Fortunately, we can use data to help us overcome these biases.

To the data!

Looking at 2017-2021 ACS data for all American Core-Based Statistical Areas (CBSAs), we can see there is indeed some correlative relationship between density and housing values, but it’s not particularly strong.

Alexander has the causal relationship backwards. Money doesn't follow housing; housing follows money. The money used to bid on housing has to come from somewhere...

Yes, the critical missing piece to Alexander's analysis is jobs. The North Dakota plains aren't just lacking housing; they're lacking jobs. If lots of high-paying jobs were to appear, the income they generate would flow into housing. If the supply of housing were limited, its value would increase.

In fact, this is exactly what happened in North Dakota during the Bakken Formation oil boom of the 2010s. Oil workers who traveled to reap the benefits of expanded oil production arrived to discover houses and apartments renting for $3,000 a month. Many found themselves living in trailers.

Fox Run RV park in Williston, North Dakota, 2015 | Photo by Andrew Cullen / Inside Energy

While housing prices are the result of many factors, there are three main drivers:

  1. The number of available jobs

  2. The salaries of those jobs

  3. The amount of housing available for those workers

For the purpose of demonstrating this relationship, we can combine variables #1 and #2 into aggregate income, which is the total income from all jobs in a metropolitan area. As expected, aggregate income and total housing supply are closely correlated.

That isn’t a very user-friendly chart so here’s an interactive version that lets you zoom in.

Metros above the fitted line have either a lot of jobs or higher-paying jobs relative to the number of housing units available. On this side of the line, we find San Jose, San Francisco, and Washington DC.

Metros below the fitted line have a lot of housing relative to their aggregate income. On this side, we find Detroit, Tampa, and Phoenix.

There’s already a pattern emerging here, but let’s make it clearer.

If we turn these two metrics into a single ratio — aggregate income per unit of housing — we can plot that against median home values.

What we find is a significantly stronger correlation! Aggregate income per unit of housing predicts approximately 56% of the variation in median values at the metro level. We now have an explanation for why San Jose is more expensive than San Francisco despite having lower housing density (one might say it's because of its lower housing density).

Meanwhile, our outliers are exceptions that prove the rule.

Places like Key West, FL, Kahului, HI, and Ocean City, NJ have high property values relative to their aggregate incomes per unit of housing because the income that drives those values up comes from jobs in other places—these are vacation home markets.

On the other side, we have places with low property values relative to aggregate income per unit of housing. Los Alamos, NM, stands out here. Los Alamos is effectively a company town for Los Alamos National Laboratory (where the atomic bomb was invented during WWII). According to their website, Los Alamos National Laboratory employs 14,150 people. The population of Los Alamos is just shy of 13,000 (some commute from nearby Santa Fe). These are high-paying jobs, but given that there's only one employer in town, the pool of potential buyers is very small, and thus property values are unusually low.


Los Alamos: Where Discoveries Are Made! (Unless you want to discover a buyer for your home when Los Alamos National Laboratory isn’t hiring).


Let’s set these outliers aside by running the data one more time but only including metros with a population larger than 1 million.

Sure enough, the relationship gets even stronger! An r-value of 0.9 suggests that over 81% of median home values in large metros can be attributed to aggregate income per unit of housing.

Change Over Time

OK, comparing metros to one another clarifies the importance of jobs and housing supply in outcomes between regions, but what we really want to know is whether building more housing in a given metro (above and beyond job and wage growth) would lower the cost of housing.

Unfortunately, that didn't happen in any major metro in the last decade, so we don't have a great case study (yes, this is why every city is becoming unaffordable). But we can see that there's a strong relationship between the change in aggregate income per unit of housing and the change in median property value over time, just as there is across cities for a given period of time.

This model is even stronger for predicting changes in rents; 74% of these changes can be explained by changes in aggregate income per unit of housing.

For a far more rigorous analysis of this relationship within a single city over time, please refer to Erica Fischer’s brilliant work collecting and analyzing 30 years of for-rent ads in San Francisco:

Green Line: # of units, wages, and #of jobs | Purple Stars: median rent in San Francisco

While it might help reduce the cost of housing, I don't suspect anyone wants aggregate income in their city to fall. Affordable as they may be, the story of cities like Detroit and St. Louis is not a happy one.

That leaves us with one big lever: housing supply. The only real way to reduce housing costs is to build more housing for that aggregate income to flow into.

"Build more housing" isn't a singular policy, but a coherent suite of policies that begins to address the challenge on a variety of regulatory fronts. That suite includes eliminating single-family zoning (as recently enacted in Minneapolis and Portland), abolishing parking minimums, and updating building codes to allow more efficient use of floor plates with single-stair apartment buildings. It may also involve experimentation with land value tax as a method to incentivize development and reduce land speculation. Less obvious factors like immigration policy play a role in construction costs.

Perhaps most centrally, the "Build more housing" policy suite must include reforms that address the vetocracy that governs housing development in the United States, which co-opts environmental review and community oversight mechanisms to ensure that very little gets built in American cities. As Jerusalem Demsas aptly writes, our communities have become "like a homeowners' association from hell, backed by the force of the law."

How did it get so bad? As a former city planner, it pains me to acknowledge that upstream of this crisis we find the planning profession’s active abdication of power following the reckoning of mid-century urban renewal. As Thomas Campanella wrote in Places Journal, “Planning in America has been reduced to smallness and timidity, and largely by its own hand.” Addressing the housing crisis will require planners to step up as the adults in the room, becoming a muscular-yet-accountable force for the greater good rather than stewards of homeowner selfishness.

There’s no reason we can’t have wealthy and affordable cities. We just have to increase the denominator of aggregate income per household.

Let’s return to Alexander.

I don't see why Oakland being able to tell a different story of how it reached Manhattan/London density levels ("it was because we were YIMBYs and deliberately cultivated density to lower prices") would make the end result any different from the real Manhattan or London.

In fact, the YIMBY story would make a world of difference in the end result! The story of Manhattan and London is one of housing supply lagging behind a dramatic growth of high-paying jobs. Their housing densities mask an even greater density of jobs. When jobs boom, it can be hard for housing supply to keep up, but it’s not impossible. A story in which housing supply keeps up with job growth creates a housing market more like that of Tokyo.

Alexander's argument overlooks the critical role of jobs and income in the housing price equation. The data shows us that it's largely the ratio of aggregate income to housing supply that’s really driving housing prices. The key to our affordability crisis is ensuring that housing supply keeps up with local job markets.

Scott Alexander, I hope I've changed your mind.


Notes

  1. You may be surprised to see New York’s relatively moderate home values. At first I thought this may be due to data collection during the pandemic, but I checked the 2007-2011 and 2012-2016 ACS data and it looks basically the same. I suspect this is due to some combination of the New York CBSA boundaries being enormous (see below) and perhaps New York homes being very small.


New York CBSA boundary

 
Kasey KlimesComment
Designing an Economy Like an Ecologist

Illustration by Claire Scully for Aeon

My collaborator Oshan Jarow and I recently made public the Library of Economic Possibility, a knowledge tool for economic ideas just outside the Overton window. LEP is motivated by our belief that the economy should be understood as a complex adaptive system and economic policy as a design problem within it. It’s also a reaction to a deep structural problem with mainstream economic thought.


Economic thinking has long been dominated by two oversimplifications that have shaped the modern world.

Oversimplification #1: The economy can be centrally planned

One has already collapsed; the economic ideas of Marx and especially Lenin, who sought an egalitarian society through the centralized control of the economy. In their effort to eliminate the capitalist class, they made a fatal error in their descriptive model of how economies work.

In reality, most of the relevant knowledge needed to coordinate economic activity is distributed throughout the system. How many nails to produce each month, for example, depends on dispersed information that planners cannot access. The inefficiencies of central planning make it unsustainable.

A Soviet control room

Friedrich Hayek described this dynamic lucidly:

"The marvel is that in a case like that of a scarcity of one raw material, without an order being issued, without more than perhaps a handful of people knowing the cause, tens of thousands of people whose identity could not be ascertained by months of investigation, are made to use the material or its products more sparingly; that is, they move in the right direction."

—Friedrich Hayek, The Use of Knowledge in Society, 1945

Hayek’s insight into decentralized knowledge in markets helps explain why free market systems outlasted communist planning.

Unfortunately, Hayek’s insight was overshadowed by the second oversimplification.

Oversimplification #2: The economy is a static model

The impulse to exert control also underlies this second misconception, which continues to shape policy today. In the late 1800’s, economists like William Stanley Jevons and Léon Walras sought to model the economy as a mathematical equation.

Physics is rich with elegant mathematical equations, so these economists took them. I mean this quite literally. The neoclassical economic model of general equilibrium, which can be found in nearly every economics textbook of the last century, was lifted from chapter two of French mathematician Louis Poinsot's Elements of Statics (1803) by Léon Walras. Walras made this model the centerpiece of his Elements of a Pure Economics in 1872, and it spread rapidly in the decades that followed.

Our modern economic system relies on a 220-year-old physics model that was already rendered obsolete among physicists by new understandings of entropy and thermodynamic behavior at the time that Walras was taking it to Kinko's.

However, in order to turn the economy into a simple static model, neoclassical economists had to make a few assumptions (the first of which effectively erases Hayek's 1 insight):

  1. Everyone has perfect information at all times.

  2. People always act rationally and logically.

  3. Everyone has access to at least some amount of every possible good and service.

  4. There are futures markets for everything.

  5. The probabilities of all future events are known with certainty.

  6. There is no social or collective agency, no shared goals or common interests—there is only the individual.

Why would the backbone of modern economics accept these obvious distortions of the real world?

Because without these assumptions, the math doesn't work!

The neoclassical model’s assumptions take it to a radical end: If markets always find balance, then the sole role of policy must be to cease meddling with their course. Simply put, we must eliminate all forms of intervention. But in mistaking model for reality and logical extreme for pragmatic mandate, this conclusion casts a spell that has cost us dearly.

Beginning in the 1970’s, this ‘free market fundamentalism’ drove deregulation, privatization, attacks on unions, financialization, and cuts to public services.

The previous economic model had its own clear failings, but if economic growth, shared prosperity, and business dynamism were the goal of the new system, then this project has failed. Economic growth has slowed to a crawl, inequality has skyrocketed, and we now have more businesses dying than being born. Rather than tending towards equilibrium, a strict adherence to non-interventionism has led to a new form of consolidated control by rent-seekers in the private sector.

High modernist economics

Let’s turn to Hayek again.

“The curious task of economics is to demonstrate to men how little they really know about what they imagine the can design.”

—Friedrich Hayek, The Fatal Conceit, 1988

There’s an irony in Hayek’s critique of economic interventionism, since the free market fundamentalism that he supported exhibits the very same ‘design’ impulse he criticized.

‘Design’ for Hayek referred to the dominant approach of his era, high modernism.


High modernism, by Midjourney


High modernism is a design paradigm characterized by:

  1. Strong belief in scientific and technological progress. High modernists held a utopian faith in experts and intellectuals to use scientific knowledge to master nature and society.

  2. Attempts to control and redesign complex systems. High modernism tried to impose order on organic or historical environments using engineering-inspired methods to rationally plan and optimize systems.

  3. Disregard for context and specificity. A "one-size-fits-all" approach ignored local history, culture, geography, and differences in favor of universal “scientific” principles.

  4. Reliance on legibility and efficiency. The goal was to make systems more transparent and efficient via simplification.

While free markets are seen as the opposite of communism (which clearly exhibits the failure patterns of high modernism), a modest dive into the epistemic origins of Hayek’s free market fundamentalism reveals it to carry all of the same high modernist traits. Free market fundamentalism is yet another flavor of high modernist economics.

Communism

  • Perceives itself as scientific, is actually based on the pseudoscience of historical materialism

  • Technocratic view of economics as an engineering problem

  • Believes a pure state-planned economy can achieve maximum efficiency

  • Built on numerous simplifying assumptions of how the economy works

Free market fundamentalism

  • Perceives itself as scientific, is actually based on the pseudoscience of the neoclassical model

  • Technocratic view of economics as an engineering problem

  • Believes a pure market-driven economy can achieve maximum efficiency

  • Built on numerous simplifying assumptions of how the economy works

The core problem with both systems is that they aren’t based on reality. They are simplified models derived from idealized blank-slate visions of what that reality ought to look like, imposed from above on the rich complexity of real economies.

While it makes for an elegant model, economic equilibrium doesn’t actually exist in the real world. The map is not the territory and the model is not the economy. While markets have real strengths, real world economies do not follow a simple physics model’s rules.

As economist Steve Keen observes,

“There is one striking empirical fact about this whole literature, and that is that there is not one single empirical fact in it. The entire neoclassical theory of consumer behavior has been derived in ‘armchair philosopher’ mode, with an economist constructing a model of a hypothetical rational consumer in his head, and then deriving rules about how that hypothetical consumer must behave.”

— Steve Keen, Debunking Economics

How do you get a healthy ecology?

Fortunately, high modernism is not the only approach to design, nor is armchair philosophy the only approach to economics.

The prescriptions of central control or pure non-intervention are naïve responses to unrealistic economic models. Even free markets are designed — they require institutions to create, regulate, and police them.

In 2019 I attended a symposium on complexity economics at the Santa Fe Institute, where Eric Beinhocker, author of The Origin of Wealth, made a comment that framed the problem beautifully:

“Asking ‘Do you want more market or more state?’ makes about as much sense as asking ‘Do you want more plants or more animals?’ The real question is ‘How do you get a healthy ecology?’”

—Eric Beinhocker, SFI Complexity Economics Symposium, 2019

Like ecologies, economies are complex adaptive systems. They exhibit feedback loops, delays, adaptation, path dependence, nonlinearity, emergent phenomena and — importantly — people.

Economics is a social science. As the renowned physicist Murray Gell-Mann once quipped, “Imagine how hard physics would be if electrons could think!”


Ecology, by Midjourney


So how do we achieve a healthy ecology?

While no single measure can adequately describe a complex system, ecologists generally assess the health of an ecosystem with a few key indicators:

Biodiversity

The variety of species present and their relative abundances. Higher biodiversity indicates a healthy, stable ecosystem.

In economics, we might consider the ‘biodiversity’ of businesses. High market concentration suggests problems.

Nutrient Cycling

The efficient circulation of nutrients like nitrogen, carbon, and oxygen through the system. If nutrients are accumulating or being depleted, it may indicate the system is out of balance.

In economics, we might consider the velocity of money. If capital is accumulating rather than cycling through the economy, imbalances may emerge.

Resilience

The ability of an ecosystem to withstand an exogenous disturbance, and then recover from it. Resilient, healthy ecosystems can handle stress without collapsing.

In economics, we might consider whether the economy can withstand a natural disaster or, say, a pandemic. As we’ve learned, hyper-efficient supply chains don’t fare well under stress.

Indicator Species

The presence, absence, or abundance of sensitive species are indicators of ecosystem health. Indicator species are the ecological ‘canary in the coal mine’. For example, mayflies are sensitive to water pollution, so their population declines indicate impending problems.

In economics, we might consider the presence of small businesses, young people, or artists in the economy. Their struggle or decline could signal problems with economic opportunity and vitality — just as the absence of mayflies signals pollution.


Mayflies are an indicator species for water quality


Far from mechanical equilibrium or precision-tooled growth, a complexity-oriented approach to public policy might track the economy’s more organic vital signs.

Complexity-based intervention

Ecologists take a nuanced, evidence-based approach to intervening in complex adaptive systems.

Consider their work on trophic cascades to increase biodiversity in Yellowstone park. By reintroducing grey wolves 70 years after they had been killed off, ecologists set off a chain reaction of ecological restoration. The wolves put the deer and elk population back in check, which made room for a resurgence of trees and vegetation. This increased the diversity of birds and increased the population of beavers, whose dams provided habitats for otters, muskrats, ducks, fish, reptiles and amphibians. The intervention even stabilized river banks and altered river behavior. A careful design intervention triggered self-reinforcing positive change, restoring ecosystem balance and a dramatically improving ecological health.

Other interventions include restoring mangrove forests in coastal wetlands to enable nutrient cycling and reduce fertilizer runoff, or creating wildlife corridors to connect fragmented habitats and boost biodiversity.

Ecologists developed these interventions through an empirical understanding of how ecologies work in the real world. They observed the dynamic behavior of food webs and ecological response to disturbances. They ran controlled and natural experiments, beginning with small-scale interventions, testing and evaluating before expanding the idea to larger ecosystems. Much like the systems they study, ecologists are adaptive and change their approach as they learn more about how the system behaves and responds to change.

Economic possibilities

I believe economic thinking would better support flourishing societies if it adopted ecologists’ approach to natural ecosystems. Fortunately, many economists are already doing the hard work of empirical research into potential interventions within the context of economic complexity and have been for quite some time. Rather than forcing a simple model on complex reality, they are building a nuanced understanding of the economy starting with observations in the real world.

For example, a 2019 study by Reimer, Guettabi, and Watson found that a universal $1,000 payment from the Alaska Permanent Fund — a natural experiment in basic incomedecreases the probability of an Alaskan child being obese by as much as 4.5%. They estimate that a national expansion may therefore trigger self-reinforcing positive change resulting in medical cost savings of approximately $310 million.

Or consider the 2016 study that studied the effects of a land value tax in Harrisburg, Pennsylvania. In the period following the intervention, the number of vacant lots fell by 80%, the tax base rose from $212 million to $1.6 billion, and crime was cut in half.

Illustration by Cristiana Couceiro for LEP

Our mission at the Library of Economic Possibility (LEP) is to make the nuanced work of these economists more accessible to the public. By collecting and sharing studies on the real-world effects of new policy approaches — both successes and limits — LEP aims to help ground popular economic thinking in an empirical and pragmatic understanding of what might be possible amid complexity. From land value tax to worker codetermination, carefully designed economic interventions may trigger virtuous cycles of prosperity and resilience — if we are willing to experiment with a pragmatic eye towards ecological health.

The economy is not a machine to be programmed or a windup toy to be set loose, but a garden to be tended. Careful intervention informed by pragmatic learning can tip systems into virtual cycles that outstrip our narrower aspirations of control. It’s time to move past high modernist economics. The economy awaits the hands of humble student-stewards — willing not just to act on it, but to learn how it acts in turn.


1 Hayek is a complicated figure in economic history. Though he was heavily involved in the turn toward free market fundamentalism and is often associated with neoclassical economics, his ideas about distributed knowledge constitute an early understanding of the economy as a complex system. Accordingly, he believed that the economy was too complex for equilibrium analysis and that people do not necessarily maximize utility.

Kasey KlimesComment
When to Design for Emergence

For years, I’ve heard some variation of the following lament from clients, collaborators, and friends with startups:

“There’s so many use cases we could solve for, but every user we talk to wants something different, and we just don’t know which ones to focus on.”

or,

“We’ve designed for all the common and important user needs and now we’ve hit a ceiling. How do we grow without bloating our product with minor features?”

Both statements describe what we can call the long-tail problem. It’s very common—I’ve seen the long-tail problem at tiny two-person startups and at Big Tech corporations with billions of users.

In the long-tail problem, all the opportunities in front of you live on the long tail of user needs. Collectively they represent many users, but individually none of them appear important enough to invest time or resources in.

Common needs represent large markets, but the needs are largely met, and competition between solutions is fierce. Long-tail needs are often unmet and come with much less competition, but individually represent markets too small to justify the expense of development.

Let’s look at some example user needs from the world of digital mapping.

Examples from @tophtucker, # of user estimates based on my time at Google Maps

Perhaps the most common user need we see in the mapping space is “How do I get there from here?” Such ubiquitous user needs are experienced by nearly everyone, often many times a day. Purpose-built solutions in the “traditional” style of product development often work well here (if you can hold your own in a crowded market). Long-tail user needs, like “Is this passable at low tide?” represent a comparatively small group of people, yet the investment required to build an adequate solution often remains the same.

There is a way of addressing the long-tail problem, but it requires a very different paradigm for thinking about the way we design products, tools, and services. We can call this paradigm design for emergence.

In complexity science, ‘emergence’ describes the way that interactions between individual components in a complex system can give rise to new behavior, patterns, or qualities. For example, the quality of ‘wetness’ cannot be found in a single water molecule, but instead arises from the interaction of many water molecules together. In living systems, emergence is at the core of adaptive evolution.

Design for emergence prioritizes open-ended combinatorial possibilities such that the design object can be composed and adapted to a wide variety of contextual and idiosyncratic niches by its end-user. LEGO offers an example — a simple set of blocks with a shared protocol for connecting to one another from which a nearly infinite array of forms can emerge. Yet as we will see, design for emergence can generate value well beyond children’s toys.

In many ways, design for emergence is an evolution of the design paradigms of past and present. Let’s take a look at the past to place this future in context.

High Modern Design

The mid-20th century saw the apex of high modern design. This paradigm was characterized by a hubristic disregard for context, history, and social complexity in favor of an imposed rational order and universal standardization. “Rational” in this paradigm describes a state of superficial geometric efficiency as conceived by the designer.

‘Ville Radieuse’ as proposed by Le Corbusier in 1930

The clean, geometric forms of Brasilia do little to support the inherent messiness of daily life for real people.

In high modernism, not only does the designer exert near-total control over the design, he also operates under the assumption that he holds all relevant knowledge about the design problem.

If we plot these two dimensions—knowledge and control—on a simple chart, high modern design occupies a distinct quadrant.

High modern design was widely discredited following a series of high-profile failures in the 1970s and 80s, ranging from the demolition of Pruitt Igoe to the collapse of the Soviet Union. By the end of the 20th century, a new design paradigm had taken its place.

User-Centered Design

In contrast to high modern design, user-centered design takes a more modest position; the designer does not inherently know everything, and therefore she must meticulously study the needs and behaviors of users in order to produce a good design. User-centered design remains the dominant design paradigm today, employed by environmental designers, tech companies, and design agencies around the world.

User-centered design suggests identifying well-trodden ‘desire paths’ and designing for them (in this case by paving a new sidewalk).

While user-centered design discards the high modern assumption that the designer always knows best, it retains the idea that the designer should maintain control. In this paradigm, design is about gaining knowledge from the user, identifying desirable outcomes, and controlling as much of the process as possible to achieve those outcomes. ‘Design’ remains synonymous with maximizing control.

User-centered design has a better track record than high modern design, but it still exerts a homogenizing effect. The needs of the modal user are accommodated and scaled through software or industrial manufacturing, while power users and those with edge cases can do nothing but actively petition the designer for attention. In most cases, diverse users with a wide variety of niche use cases are forced to conform to the behavior of the modal user.

In many cases this is sufficient. Don Norman, who coined the term ‘user-centered design,’ is infamous for his ‘Norman Door’ design example. User-centered design generally works well as an approach to solving common problems like permeable separation between spaces (i.e. the common problem doors solve) or comfortable food preparation.

But consider even the ‘desire path’ example pictured above. The modal user may be well supported by paving the desire path indicated by their behavior, but what good is a paved path leading to stairs for a wheelchair user? In practice, user-centered design tends to privilege the modal user at the expense of the long-tail user whose needs may be just as great.

User-centered design tends to optimize for the average

Long-tail users of user-centered design are not given the degree of control necessary to adapt the design object or tool to their unique needs, and designers are faced with the long-tail problem mentioned earlier.

This is where design for emergence offers an alternative.

Design for Emergence

In design for emergence, the designer assumes that the end-user holds relevant knowledge and gives them extensive control over the design. Rather than designing the end result, we design the user’s experience of designing their own end result. In this way we can think of design for emergence as a form of ‘meta-design.’

What does it mean to give the user control?

Ashby’s Law of Requisite Variety states that enabling control depends on the controlling system (i.e. the tool) having at least as many possible states as the system it controls (i.e. the end-user’s design problem). In Ashby’s words:

In order to deal properly with the diversity of problems the world throws at you, you need to have a repertoire of responses which are (at least) as nuanced as the problems you face.

In other words, to address the long-tail problem, the tool must be flexible enough that it can be adapted to unexpected and idiosyncratic problem spaces—especially those unanticipated by the tool’s designer.

We can draw a useful boundary around design for emergence with the following criteria.

1. The designer can be meaningfully surprised by what the end-user creates with their tool.

Design for emergence is open-ended. There’s no room for surprise in high modern or user-centered design, unless the design is exapted for an unintended use (see “Design Exaptation” in the bottom right quadrant of the 2x2 above). Meanwhile, a key characteristic of design for emergence is that the end design may be something that the original designer never imagined. Whereas exaptation may indicate a design failure, this kind of surprise is an indication that the designer has succeeded in nurturing emergence.

Design for emergence is permissionless. It empowers people by way of its constitution even though it can never know what people will do with that power. In contrast to user-centered design, design for emergence invites the user into the design process not only as a subject of study, but as a collaborator with agency and control.

2. The end-user can integrate their local or contextual knowledge into their application of the tool.

Design for emergence is context-adaptable. It leverages distributed, local intelligence. In machine learning, a variation of the long-tail problem manifests as an increasing amount of data required to generalize a model across applications (e.g., training a robot to open a particular door versus training a robot to open any door). Data has diminishing returns. The pattern holds true for long-tail problems as approached by user-centered design—the cost of information about users holds steady but satisfies an ever-smaller number of users. 

Rather than trying to collect and incorporate all possible relevant information, design for emergence gives form to systems on the basis of general information while letting end-users “finish the job” with their unique on-the-ground knowledge.

3. The end-user doesn’t need technical knowledge or training to create a valuable application of the tool.

Design for emergence is composable. It provides a limited ‘alphabet’ and a generative grammar that’s easy to learn and employ, yet can be extended to create powerful, complex applications. As Seymour Papert once remarked, “English is a language for children,” but this fact, “does not preclude its being also a language for poets, scientists, and philosophers.”

To borrow another metaphor from Papert (and Mitchel Resnick), design for emergence needs:

  • Low floors (an easy way to get started)

  • Wide walls (many possible paths)

  • High ceilings (ways to work on increasingly sophisticated projects)

Low floors are especially important in a market context as most users are not technical. For this reason, design for emergence often looks like a ‘kit of parts,’ with ease of use operating largely as a function of the number of parts and the number of ways they can be joined together. Limiting both quantities keeps the floor low, while the combinatorial explosion of possibilities that even a limited set can generate produces wide walls and high ceilings.


While design for emergence is in the midst of being rediscovered, it is hardly a new paradigm. Christopher Alexander’s A Pattern Language (1977) was a ‘kit of parts’ in the form of 253 design patterns. His design theory has close theoretical parallels to complexity science, which studies the natural phenomena of emergence. Oskar Hansen diverged from his high modernist roots in the direction of design for emergence with his participatory theory of ‘open form’ in the 1960’s. Questions of user control in system design are also central in cybernetics, which goes back at least as far as Norbert Weiner’s 1948 publication of Cybernetics: Control and Communication in the Animal and the Machine.

Perhaps the best historical example of design for emergence in a popular application is HyperCard, released by Apple in 1987. HyperCard could be easily adapted to unanticipated purposes. Children used it to create and organize databases of game cards. Academic researchers used it in psychological studies. Restaurateurs used it to report orders coming through registers. HyperCard was even used to control the lights on two of the world’s tallest buildings, the Petronas Towers in Kuala Lumpur, Malaysia. Creator Bill Atkinson described HyperCard as a programming tool "for the rest of us,” and, “an attempt to bridge the gap between the priesthood of programmers and the Macintosh mouse clickers.”

Hypercard was laid to rest in 1998. Despite its adoring user base, Apple executives didn’t believe it could make money. While this may have been true in 1998, the rise of software-as-a-service (SaaS) business models has made design for emergence once again financially viable.

Today, design for emergence—made profitable by SaaS—supports an enormous market of left-behind long-tail users.

Notion is a philosophical descendent of HyperCard (turns out you can even buy a third-party HyperCard-themed Notion template) that offers extremely adaptable information structures built from an alphabet of ‘content blocks’. It’s also worth $10 billion and has 30 million users. I used it to create the first bidirectionally linked note-taking system that matched my own idiosyncratic research needs.

ClickUp is a project management tool that “flexes to your team's needs” with a modular structure composed of a handful of ‘ClickApps’ and Views. The five-year-old company is growing at a rate that would make most startups blush. Elsewhere, ‘nocode’ tools like Airtable, Webflow, and Zapier have found great commercial success with their composability, interoperability, and extensibility.

Then there’s the great destroyer of would-be single-purpose tools, the software market juggernaut Microsoft Excel. With a small handful of data types and a two-dimensional grid of cells, non-technical users can make simple calculations (low floor) or design massively complex data systems (high ceilings), adapted to their specific needs and without IT support. Generations of enterprise software designers have had to answer the difficult question: “Why wouldn’t our users just do this in Excel?” 

VisiCalc, the predecessor to modern digital spreadsheets, was released by Apple in 1979.

Web-based competitors like Google Sheets leverage yet another tactic for emergence by introducing multiplayer capabilities to the already powerful end-user programming tool. Together these digital spreadsheet tools support billions of monthly active users worldwide.

What all these tools have in common is support for open-ended adaptation to highly contextual problems without the need for technical knowledge. Rather than building a static, purpose-built solution to a single common problem with lots of users (and lots of competitors), they’ve won robust user bases by supporting a broad swath of long-tail user needs.

In future posts we’ll explore tactics for how to design for emergence, but for now I’ll leave you with a question:

How many markets are currently sitting untapped on the long tail, waiting for tools that empower emergence?

Kasey KlimesComment
Design Needs Complexity Theory

Despite Christopher Alexander’s notable application of complexity theory in design during the 60's and 70's, the two fields have mysteriously grown apart. The contemporary design world demonstrates little interest in complexity theory, and design is generally absent in the world of complexity theory. I think this separation is not only a missed opportunity, but also a tragic error for humanity on a larger scale.

Forgetting Christopher Alexander

In the spring of 2011, when I was a design student in Copenhagen, my professor loaned me a copy of Christopher Alexander’s A Pattern Language (1977).

Heavy with thin pages, the red, leather-bound book felt like a Bible in my hands. Although I didn’t fully grasp what I was reading at first (in some ways I'm still trying to wrap my mind around it), I realized that Alexander was describing a truth about reality which was much deeper than architecture.1 I had never read anything like it—it was somehow mathematical yet poetic, sophisticated yet straightforward, philosophical yet practical. After finishing A Pattern Language, I swiftly devoured as many of his books and essays as I could find.

A proper introduction to Alexander’s work would require its own book, but I’m going to summarize the important elements with a crude ontology.2 I view Alexander's work as a series of concatenated levels: an object-level artifact or tool; an information architecture that structures the artifact; a process that generates that information architecture; an epistemology that implicates that process; and a moral value system that motivates all of the above. Let’s dive in.

Level 1: Artifact

At the surface level, A Pattern Language is a design and construction handbook for everyone. It contains 253 rules of thumb expressed in the form of patterns. Patterns are reusable sets of relationships forged over time to address common problems. For example, first-floor window sills should be 12 to 14 inches high (pattern #222). Car parking should occupy no more than 9% of land (#22). Balconies should be no shallower than 6 feet (#167). Patterns in this sense are highly applicable and concrete.


Labeled excerpts from A Pattern Language

Labeled excerpts from A Pattern Language

Level 2: Information Architecture

A Pattern Language is believed to be the first book written in hypertext, with non-hierarchical links (see “context” above) between closely related patterns. This was by necessity, as patterns form an interconnected web which can generate a vast range of combinatorial possibilities to address unique, contextual needs. As suggested by the title, this format is similar to a language in which just a few letters can be combined in many ways to form tens of thousands of words, which can be combined in even more ways to form an infinite number of sentences.3

Level 3: Process

Patterns must be applied and interrelated through a process. In texts like Systems Generating Systems (1968), The Timeless Way of Building (1979), and The Nature of Order (1981), Alexander describes a design process akin to "the way it works in nature," that is, through step-by-step adaptation. In contrast to the top-down approach of modernist design,4 Alexander's method is more like gardening. The designer accepts more limited control over outcomes in exchange for the generativity and context-sensitivity of an open-ended compositional process.

Level 4: Epistemology

Alexander describes a research method, called the “Mirror of Self” test, by which we can evaluate a design. Subjects are asked to self-examine the degree to which a given system or object (say, a salt shaker) “enhances their wholeness” relative to that of another item (say, a bottle of ketchup). Despite the unusual question, most people are able to give a firm answer—and, according to Alexander in The Nature of Order, responses are astonishingly consistent. Alexander wrote about the results, “People make the same choice, whether they are young or old, man or woman, European or African or American.”

Alexander’s method implicates an epistemological framework that allows for an objective reality beyond that which is perceptible to, “the dry positivist view too typical of technical scientific thinking.” He described aesthetics as “a mode of perceiving deep structure, a mode no less profound than other simpler forms of scientific observation and experimentation."

To the modern rationalist thinker, this likely sounds a little woo-woo. But as we’ll see, science may be catching up.

Level 5: Value System

Persistent in Alexander’s work is a call to make the world more whole through “living structures.” In Notes on the Synthesis of Form (1964), this value system is a matter of form having fit within its unique context. In The Timeless Way of Building, he describes “the quality without a name” which he later calls life or wholeness. This quality is deeply relational. In A Pattern Language, he implores designers:

“When you build a thing, you cannot merely build that thing in isolation. You must repair the world around it, and within it, so that the larger world becomes more coherent and more whole; and the thing takes its place in the web of nature as you make it.”

To Alexander, design is a process that is interwoven with the natural world around it and can, and should, positively contribute to rebuilding and improving society.

Not long after first encountering Alexander's work, I enrolled as a graduate student at UC Berkeley’s College of Environmental Design—where Alexander taught until the early 2000’s.

To my surprise, however, I could hardly detect a trace of his imprint at the CED. Despite the fact that he taught there for four decades and produced an abundance of meaningful work, Alexander was almost never mentioned. Most students made it through their entire programs without ever hearing his name.

Why were such monumental ideas seemingly erased?


An Absence in Complexity

In the fall of 2019, I found myself at the Santa Fe Institute with some of my friends and colleagues from Google. We are all deeply fascinated by complex systems, so being at SFI—the world-renowned epicenter of complexity science—felt to us a bit like a trip to Mecca.

The event we were attending was a fairly small three-day symposium. To our amazement, we frequently found ourselves in conversations over coffee with luminaries like Geoffrey West (author of Scale), Eric Beinhocker (author of Origins of Wealth), Joshua Epstein (pioneer of agent-based modeling), and Brian Arthur (a godfather of complexity economics). Occasionally we’d step out into the dry New Mexico air to give our aching brains an opportunity to process everything.

Though he had passed away four years prior, the presence of John H. Holland—a leading figure in the genesis of complexity science and an SFI founder—was strongly felt. As I think many at SFI would agree, there’s likely no better person from whom we can learn the basics of complexity.

Holland characterized complex systems as exhibiting the following five behaviors:

1. Self-organization

Elements of the system self-organize into ordered patterns, as occurs with flocks of birds or schools of fish.

2. Chaotic behavior

Small changes in initial conditions produce large changes later on (popularly known as 'the butterfly effect').

3. 'Fat-tailed' behavior

Extreme events (e.g. mass extinctions and market crashes) happen more often than a normal (bell-curve) distribution would predict.

4. Adaptive interaction

Interacting agents (like traders in a marketplace or players in a Prisoner's Dilemma) update their strategies in diverse ways as they accumulate experience.

5. Emergence

Spontaneous, global order results from many local interactions between agents who lack a source of centralized control.

The leaderless murmuration—caused by each starling adapting its flight path in response to that of its nearest neighbor—is a classic example of emergence.

The leaderless murmuration—caused by each starling adapting its flight path in response to that of its nearest neighbor—is a classic example of emergence.

Since complex systems exist in such a wide range of phenomena, SFI convenes a vast breadth of disciplines. At the symposium, we met physicists, political scientists, epidemiologists, economists, sociologists, ecologists, computer scientists, and even philosophers.

To my surprise, however, there were no designers. No architects, no industrial designers, no graphic designers, no urban designers, no UX designers, and no service designers. Here we were, peering into the fundamental nature of the very social problems designers profess to solve, yet they were nowhere to be found.

Why were designers absent?


Alexander gave us a starting point for applying complexity theory in design

Though Alexander’s work predates the formal term “complexity science,” both describe the same fundamental patterns of complex systems.5 Both focus on interactions within systems where the whole is greater than the sum of its parts.

For example, Alexander described pattern languages as "very complex sets of interacting rules.” Using precisely the same understanding as Alexander, a central interest of complexity science is pattern formation.

Alexander described his evolutionary design process as a "new technique that focuses on emergence” (emphasis added) towards greater fitness between form and context. Meanwhile, biologist and complexity scientist Stuart Kauffman describes evolution as a process occurring across “fitness landscapes” with “adjacent possibilities.”

Visualization of Stuart Kauffman’s fitness landscape

Visualization of Stuart Kauffman’s fitness landscape

By 2003, Alexander was in direct conversation with complexity science. He penned an essay titled New Concepts in Complexity Theory, inviting complexity science into the normative design framework.

The essay’s attempt to bridge between the fields highlights where Alexander and complexity science diverge, and begins to explain the rift we witness between complexity science and design today. While complexity science is chiefly interested in describing and understanding complex systems as they arise in nature or society, Alexander embraces the logic of complex systems into the practice of design.

“In [fields dealing with complexity] the scientists are passive as to the issue of creation. In architecture, we are the active proponents.”
New Concepts in Complexity Theory, 2003

Alexander makes the case that the kind of fitness that arises from complex systems in nature (the evolution of a bird's beak, for example) can and must be achieved by designers through new step-by-step adaptive processes.

Still, Alexander’s move towards actionable complexity doesn’t fully explain why design and complexity theory no longer overlap.

Why have design and complexity theory grown apart?

In 2005, a survey of 1,051 design professionals, faculty, and students asked respondents to prioritize various potential design research topics. Systems theory (a superset of complexity theory) ranked at the bottom of pressing matters for research. (Sustainability—which perhaps most exemplifies the need to understand complex systems—ranked first.)6

I don't know exactly why designers have turned away from complex systems, but one possibility is that complexity challenges a central doctrine of design—namely, that it is the designer’s job to identify desirable outcomes and exert as much control over the process as possible towards those ends.

In some cases, such as the design of a simple object with a simple function (e.g. a chair), this conceptualization may be sufficient.7

But in the world of complex systems—cities, economies, ecologies, society, and the like—complexity theory teaches us that the totalitarian designer’s approach is both likely to backfire in unexpected ways and sacrifices the vast networks of local intelligence distributed throughout the system.

Complexity theory suggests a new conception of design that flies in the face of mainstream practices over the last century. Reimaging design in this way will not come easily, but in many cases, it is necessary.

Why should designers understand complexity theory?

“Complexity is the science of the 21st century”
—Stephen Hawking

I believe that complexity science is the beginning of an upcoming (and deeply necessary) revolution in the cognitive tooling of society. The mental models of a deterministic machine-like reality have gotten us far in complicated domains where systems actually operate in this manner (such as Newtonian physics), but we’ve seen these methods collapse in the face of systems that are complex. Worse still, the failure of these enlightenment ideas to achieve social progress has induced a sort of epistemic resignation that the systems surrounding us are unknowable and uncontrollable, thus rendering our actions effectively meaningless. This is not true!

As a field centered around forging the future by developing new solutions, design in particular must understand complexity. The wicked problems of the 21st century—climate change, inequality, pandemics, political breakdown, and more—demand no less.

Designers must pick up where Alexander left off and develop new ways to think about and apply complexity science in our work, for three main reasons:

1. Reality is complex. We design within reality.

As I have mentioned, Alexander described good design as a proper fit between form and context. If the context is complex (as it often is) then the design of form must understand the nature of complexity. Rigid, non-adaptive, centralized, and machinistic solutions are a path to crisis.

Appropriately, complexity science may be rising in relevance due to evolutionary pressures. If we are to survive as a species in a changing environment, unfit mental models must be eclipsed by better adaptations to the world around us. And, if we are to survive, then those who design the systems around us need to be plugged into this new scientific revolution.

2. Design for emergence leverages distributed intelligence.

Emergent outcomes cannot be planned in advance, just like cities don’t follow one large blueprint and only the complex process of coevolution can create a rainforest.

This reality is not a threat to designers, but an opportunity. In many cases, thousands of minds are exponentially better than one. The final outcome may be one the original designer never imagined, and that’s exactly the point: design for emergence leverages the unique intelligence of end-users to adapt solutions to their unique contexts. This kind of design can create something wonderfully complex like a rainforest—an ecology of heterogeneous agents evolving and co-evolving novel problem solving strategies within a complex web of relationships.

Consider the wide range of adaptive outcomes made possible by digital spreadsheets, in which the simple relationships of cells (which can only contain a small handful of data types) can be combined to create highly complex systems. Digital spreadsheets have eclipsed thousands of would-be single purpose software tools because a general purpose tool designed for emergence can fulfill a wide variety of potential niches.8

Alexander attempted to leverage this kind of local intelligence by creating widely accessible tools like A Pattern Language.9 In Systems Generating Systems, Alexander describes this kind of design as a “kit of parts.” We might think of these kits as innovation-enabling innovation, from which entire ecologies of ideas and solutions might emerge.

3. Design benefits from interdisciplinary mental models

In 1969, Ludwig von Bertalanffy outlined the major aims of general system theory (a precursor to complexity theory):

1. There is a general tendency towards integration in the various sciences, natural and social.

2. Such integration seems to be centered in a general theory of systems.

3. Such theory may be an important means for aiming at exact theory in the nonphysical fields of science.

4. Developing unifying principles running 'vertically' through the universe of the individual sciences, this theory brings us nearer to the goal of the unity of science. This can lead to a much-needed integration in scientific education.

This integration is also necessary in design. The human experience is so exceptionally multidimensional that it forces us to bring together established mental models from diverse fields. Complexity theory combines these many fields, in part because it offers a shared language for collaborating across distinct areas of study and drawing value from these differing perspectives. Ecologists are sharing ideas with economists, physicists are collaborating with political scientists, and computer scientists are engaged with epidemiologists—all with promising results.

What would happen if designers joined the exchange?


1 To be fair, Alexander also had a hard time putting his ideas into words. A central idea in The Timeless Way of Building is “the quality without a name”

2 Alexander never laid out his ideas like this, it’s just how I’ve come to think of them (and the only way I can think of to condense them this much while still conveying the way they interrelate.)

3 See Portugali's The Construction of Cognitive Maps (1996) for an interesting comparison of Alexander's pattern language with Noam Chomsky's linguistic theories.

4 For a deep dive on the failure pattern of the modernist approach, see James C. Scott’s Seeing Like a State (1999).

5 Alexander’s work is sometimes described as drawing from Eastern philosophy, especially populist ideas like those found in Taoism. Complexity theory has also been described as fundamentally parallel to Eastern philosophy. Western philosophy was largely shaped by mind-body dualism, which conceives a plane of abstraction and platonic ideals divorced from material reality. Eastern philosophy, on the other hand, portrays a more embedded and cohesive conception of metaphysical reality and an orientation around interconnected relationships over categorical objects. For more on the subject check out Jeremy Lent’s The Patterning Instinct: A Cultural History of Humanity's Search for Meaning (2017).

6 Meredith Davis discusses this survey further in Teaching Design (2017)

7 On the other hand, the design of chairs may also play a role in complex adaptive systems. In the 1970’s, William Whyte made astute observations of the way people behaved with movable chairs (with which the user becomes a sort of “co-designer” by deciding the precise position of the chair) vs. stationary seating: “[movable] chairs enlarge choice: to move into the sun, out of it, to make room for groups, move away from them. The possibility of choice is as important as the exercise of it.” By making chairs light and movable, the end-user is given the agency to integrate local, temporal, and highly contextual social knowledge into an extended design process that adapts the final configuration of seating to their precise needs in that moment.

8 More examples of this sort abound in the universe of end-user programming.

9 This also helps explain why the design community didn’t embrace him—his idea was to demote them. In The Timeless Way of Building he wrote, “It is essential only that the people of a society, together, all the millions of them, not just professional architects, design all the millions of places.”

Kasey KlimesComment
A State of (Digital) Nature: Cancel culture & the gamification of political discourse
decive_twitter_web.jpg

Status hominum naturalis antequam in societatem coiretur, bellum fuerit; neque hoc simpliciter, sed bellum omnium in omnes.

The natural state of men, before they entered into society, was a mere war, and that not simply, but a war of all men against all men.

–Thomas Hobbes, De Cive, 1642

Humanity has spent the last several thousand years distancing ourselves from a state of nature, crafting structures of accountability and cooperation, balancing power, and designing rules to keep our worst tendencies in check. The internet era brought us back to square one.

The Environment

It's easy to watch the unraveling of our political discourse and believe that, somehow, people have simply lost the moral character they once possessed. But people haven't changed. What's changed are the environmental rules that govern our interactions. We can see this in the dynamics of the recent past compared to the world we find ourselves in today.

The 20th Century

  • Geographic Friction. Ideas that gained popularity in one part of the world had trouble gaining popularity in another. Ideas generally had to succeed in practice before receiving attention elsewhere.

  • Centralized Truth. A handful of institutions (both media and governmental) determined the way real-world events coalesced into an overarching narrative. These institutions enjoyed a relatively high degree of public trust.

  • Social Capital. Informal social structures were coherent and durable. In 1985, the average American reported having at least three people in whom they could confide.

Together, these elements resulted in a relatively stable intellectual environment that gave significant advantages to incumbent ideologies.

The 21st Century

  • Frictionless Wormholes. Geography is now irrelevant, and ideas spawned in one part of the globe can emerge on the opposite side overnight.

  • Decentralized Truth. Any individual with a Twitter account can now become a micro-institution of truth and reason. Tribes of meaning-making emerge from swarming micro-institutions. Trust in the pre-internet era's meaning-making institutions has eroded.

  • Atomized Individuals. Informal social structures are incoherent and weak. In 2004, the average American reported having no one in whom they could confide.

Together, these shifts result in an unstable intellectual environment that gives significant advantage to ideologies that successfully trigger a compounding feedback loop through social contagion.


"Following the light of the sun, we left the Old World." – Christopher Columbus

"Following the light of the sun, we left the Old World." – Christopher Columbus


The Tribes

Within this 21st century environment we can easily identify three major tribes that have coalesced; the reactionary right, the progressive left, and the classical liberals.

The Reactionary Right

  • Views the Left as an existential threat to traditional American culture and values that must be eliminated.

  • Seeks to reinstate hierarchies.

  • Has become larger, more extreme, and more violent.

  • Enjoys political power and represents the current White House's base.

theright.png

The Progressive Left

  • Views the Right as an unchecked threat to liberal democracy that must face consequences.

  • Seeks to inhibit the expansion of white supremacy and promote equality.

  • Has become larger, louder, and more "woke".

  • Enjoys cultural power and represents the 21st century's most accepted forms of youth culture.

theleft.png

The Classical Liberals

  • View the Left's "cancel culture" as an over-extended mob and a threat to liberal democracy.

  • Seek to preserve forums of free speech and open debate on any and all ideas that enter the arena.

  • Have become gradually less relevant as they lose ground to both the Left and Right.

  • Enjoy institutional power and represents the 20th century's incumbent "establishment" ideology.

classicalliberals.png

The Game Loop

At the center of the 21st century's new world order is a simple game loop. I will use Twitter as an example but the dynamic plays out just as easily on Facebook or any other social media platform. The loop begins with a young, typical American of the 21st century – atomized and disconnected, with no friends or family in whom he feels he can confide.

 
gameloop.png
 
  1. Validation. He joins Twitter and quickly finds that when his tweets are mildly political, he receives more likes and retweets. These are satisfying dopamine hits. Perhaps he held some doubts about his views when he tweeted, but now his doubt is gone. He feels social validation for the first time in ages.

  2. Tribe Affiliation. Current events–say, a Black Lives Matter protest–provides fuel for any of the tribes described above. He may choose to focus on police brutality and tweet "Black Lives Matter!" in support, and receive validation from the Left. Or he may choose to focus on property damage, tweet "The rioting must stop!" and receive validation from the Right. He is subsequently exposed to and internalizes more extreme ideas (some of which are surfaced via ranking algorithms).

  3. Tribe Status. Soon, the tweets are as much a signal of in-group status as they are political commentary. The unspoken game is a competition of who can be the most pure and true to the cause. One path leads to "ACAB," another to "MAGA." The sense of influence and power he gets from watching his likes and retweets skyrocket is addictive.

  4. Totalization. The young man is no longer capable of seeing beyond the totalizing worldview that embraced him and gave him a sense of belonging. He is now the one validating other disillusioned people. The game loop has hit its asymptote.

This pattern has been repeating itself around the globe for years. It eventually spills out of the internet and into the real world; a recent study in Germany found a significant relationship between Facebook usage and violent attacks on refugees. Social media is a machine for turning the basic human need of acceptance into extremism.

Cancel Culture

Classical Liberals often call for a "free marketplace of ideas". Ironically, that is precisely what social media provides–ideas are transacted nearly instantaneously and without the friction of geography. It is an evolutionary environment for thought. Ideas with high transmissibility can rapidly proliferate.

Contrary to Classical Liberal claims, however, this freedom does not mean "the best" ideas win. Like a virus successfully adapted to take advantage of the human need for physical contact, the ideas that take advantage of the game loop are the ideas that triumph. Both cancel culture and the right-wing extremism it seeks to constrain are emergent outcomes of the internet and the design of its platforms.

Classical Liberals Abide by 20th Century Logic

Echoing a common liberal refrain, the recent Harpers letter wrote that, "the way to defeat bad ideas is by exposure..." This classical liberal framework functioned beautifully in the 20th century, but we no longer live in that era. Exposure to bad ideas (coupled with the validation and contagion mechanisms of social media's game loop) is precisely what leads to more extreme outcomes. The more extreme the idea, the more validation it receives–and the possibility that it becomes the subject of outrage as well only serves to push the individual closer to the voices of validation.

In the pre-internet era, we had both geographic friction and centralized (and often regulated) sources of truth. Today, we have neither. This new reality leads us to a situation that tests the bounds of the liberal framework. How would we have responded, for example, if Al-Qaeda recruited outside of American high schools in the 1990's? At the time, of course, this was impossible. Today, it is not. The internet creates wormholes.

wormhole.png

Invasive Thought-Species & Extralegal Mob Justice

In nature, evolutionary environments achieve meta-stability in the absence of exogenous shocks. Among the possible exogenous shocks that can knock an ecosystem into chaos is the sudden introduction of a predator from another ecosystem, such as the South American cane toad in Australia, the Japanese beetle in North America, or the Burmese python in the Florida Everglades. These invasive species multiply and terrorize with no natural predators to keep them in check.

If ideas are akin to species in an evolutionary environment, then the digital wormholes of the internet are the cargo ships that unwittingly transport invasive thought-species to new land. Like invasive species in nature, invasive thought-species can quickly dominate an unsuspecting ecosystem.

X-ray of an American alligator in the belly of a Burmese python. These species evolved continents apart.

X-ray of an American alligator in the belly of a Burmese python. These species evolved continents apart.

There is no (and perhaps can be no) formal recourse for the introduction of an invasive thought-species. Any attempt at formalizing consequences quickly leads to thought-policing. The law can only respond to the most extreme real-world effects of the invasive thought-species (e.g. violence). By that time, however, it is far too late; the invasive thought-species has become unstoppable and has already propelled itself to the White House.

So emerges the "cancel culture" of the Left; a networked attempt at preventing the spread of right-wing invasive thought-species with which formal legal structures cannot reckon. In other words, extralegal mob justice.

Extralegal mob justice is a crude and imprecise tool. There is no due process, no precedent, no carefully articulated legal boundaries. In its desperation to stop the social contagion of right-wing extremism by striking earlier in the game loop, it hunts down milder and milder cases until wholly innocent people join the list of casualties.

Another manifestation of the game loop, extralegal mob justice provides its own brand of social validation and in-group status, thereby swelling its ranks and expanding its scope even as it generally fails to impede the growth of right-wing extremism. The individualized addiction to likes and retweets is joined by collective dopamine hits for the tribe, what Helen Lewis describes as "the cheap sugar rush of tokenistic cancellations," which are far removed from any real structural changes (except for new corporate PR strategies).

Now we have right-wing extremists and extralegal mobs to worry about, warring against the backdrop of perfectly-unblemished castles of structural injustice (meanwhile, the liberals are off somewhere penning another open letter).

A Fitness Function for the 21st Century

The result of the game loop and the 21st century environment is a new Hobbesian state of nature: a "war of all men against all men." The formal structures and institutions of the 20th century–perhaps the pinnacle of human progress–are impotent in this new world. Where do we go from here?

We can begin by acknowledging a key difference between our current state of nature and the one that Hobbes described from the dawn of history; much of this environment was designed–not by gods or by natural laws, but by engineers and designers in Silicon Valley. These technologists are the most consequential architects the world has ever known. While their intentions may be pure, intentions matter very little at the scale of civilization. The consequences of a few seemingly small decisions born on a whiteboard in California have threatened centuries of human progress.

The fitness function of today's internet–the environmental rule set to which our discourse is adapted–leads us in ever-more extreme directions. By looking upstream, however, we can begin redesigning the mechanisms of the game loop and end the gamification of political discourse.

  1. Unplug The Scoreboard. We can improve the quality of our online discourse by attenuating the role of quantity in the design of social media interfaces. In other words; to end the game, unplug the scoreboard. Today’s online experience is a flurry of numbers at the expense of real communication. The demetrification of social media–the elimination of "points" in the form of likes and retweets–can create space for emphasis on the content of messages rather than their “performance”. While a ‘Like’ button may seem inconsequential, it is precisely where the game loop begins.

  2. Let Users Design Their Algorithm. We can reassess the need for algorithmic ranking of social media content–which boosts the sensational at the expense of the nuanced and accurate–or, reimagine the design of those algorithms. Why not allow users to determine the criteria by which their content is sorted? The current behavioralist approach assumes that because I click on outraging content that I must want outraging content. Instead, platforms could give users an opportunity to stop and consciously articulate what they want from their social media experience.

  3. End Engagement-Based Business Models. We can acknowledge that Silicon Valley's technologists are merely a middle-layer in a Russian nesting doll of warped incentives; the designers of these systems are themselves a subsystem. Tech firms are players in a shareholder-based economy that demands maximized returns. Social media platforms are designed as games to be won because games are highly profitable. The game loop that drives tribal extremism is the same one that drives engagement overall, so change won't come voluntarily. The tech-sector regulation of the 21st century must realign these incentives so that the aforementioned redesigns (and others we have yet to imagine) might be possible.

  4. Rebuild The World Beyond The Screen. We can work to rebuild our social support structures back in the real world so that the human need for social connection needn't be found in the welcoming arms of online extremists. We can regenerate community in neighborhood spaces, local support structures in civic organizations, and opportunities for connection in both new and time-tested forms of social infrastructure. Physical, human connection remains the strongest antidote to our social challenges even as they manifest in virtual spaces.

The ecosystem of our collective meaning-making apparatus has been knocked into chaos, threatening the basis of global liberal democracy. This isn’t the world that anyone meant to create, but through a series of accidents and unintended consequences it is indeed where we have found ourselves: a digital war of all men against all men. We’ve navigated our way out of a state of nature once before. Do we have the fortitude to do it again?

Kasey Klimes Comment
The Pandemic Imperative
Scenes from the 1918 Spanish Flu pandemic, which infected nearly a third of the world's population and killed some 50 million people.

Scenes from the 1918 Spanish Flu pandemic, which infected nearly a third of the world's population and killed some 50 million people.

Important Note: I am not an epidemiologist, virologist, or public health expert of any kind. Nothing here should be interpreted as a perspective from any authority on scientific matters.


Moral calculus changes dramatically during a pandemic. Actions that might have little or no ethical consequence during normal times – taking a vacation, holding a large event, or shaking someone's hand – suddenly take on enormous moral weight. Even the most forgettable action can be lethal. When death grows exponentially through a human network and our institutions are corrupted to inaction, our last line of defense is the moral obligation of every individual to the rest of society.

Kant's Categorical Imperative

In describing the criteria by which we should judge moral actions, Kant gave us the following rule:

Act only on that maxim through which you can at the same time will that it should become a universal law.

In other words, would you want to live in a world in which everyone behaves the way you are right now? If so, you can reasonably call it moral behavior. If not, it is immoral behavior.

Moral living, then, requires ongoing thought experiments in the effect of individual choices at scale and over time. You may, for example, run the decision to take an annual vacation to the Caribbean through the thought experiment.

At the scale of the individual and over short-time horizons, there appears to be little about taking a vacation that's morally questionable. But, implementing Kant's thought experiment, we have to ask: Would we want to live in a world where everyone takes an annual vacation to some sunny locale? We may argue that this would be a fine world. There's even a case to be made that there are morally positive outcomes to everyone hitting the beach – it will help stimulate local economies and maybe de-stress everyone enough that we're all a bit kinder to each other upon our returns. In short, it probably passes the test.

What's important to note here is that the conclusion of the thought experiment relies on projecting the nth-order effects of actions and their relationship with systemic factors beyond the individual.

Small Actions & Major Consequences

Enter stage left: COVID-19.

Let's run a very simple (hypothetical) model. One person is infected with coronavirus. While they're asymptomatic, they infect 3 other people, for a total of 4 cases. Each of those newly infected people infects another 3 people, for a total of 10 cases. Go through this process just 10 times and the result is over 65,000 infected people that can be traced back to those first few transmissions. This is the butterfly effect on steroids.

A virus that infects more than one person for every individual infected will grow exponentially through a population. A little more crude math: as of this writing, we're seeing an average of +15% day-over-day growth of new confirmed cases outside China. Given ~35,000 confirmed cases outside China today, holding that growth rate constant would result in 1 million in two weeks, and more than 2 million by the first week of April.

To demonstrate just how much that rate impacts outcomes, tamping it down to 10% day-over-day growth would lead to "only" a half million cases by the beginning of April. Meanwhile, if we start with our current 15% growth rate but reduce it by just 5% each day (so that the growth rate is 15% today, 14.3% tomorrow, 13.5% the next day, and so on) the curve flattens out by the end of the month.

Modeled growth of confirmed cases outside China through April 8.

Modeled growth of confirmed cases outside China through April 8.

"But all bringing the rate down does is slow down the virus, if it's still growing then that doesn't mean there's going to be any fewer infections in the long run!"

Well, perhaps. As public health experts have reminded us, the big difference is that by slowing it down, we increase the odds that our healthcare system can handle the surge of demand from new infections. If the number of infections at any given time overwhelms the hospitals, then it's possible that we'll see a rise in the fatality rate as we run out of doctors, beds, and ventilators.

IMG_0997.jpg

Ethical Actions

The good news is that the rate of growth is not fixed. The quicker we can bend the growth rate downward (i.e. "flatten the curve"), the better our odds of preventing global tragedy on a scale with which few living people are familiar. In China, where drastic measures were taken to reduce person-to-person contact, the rate of growth fell by roughly 15% per day (three times as fast as the variable growth model shown earlier) from roughly 25% in early February. Whereas early February saw new cases rise day-over-day by as much as 30%, the number of new cases in China is now falling.

Few countries can execute the kind of actions China took. Others, like the United States, appear unprepared to do much of anything. This situation is deeply unfortunate, but the reality it generates distributes moral responsibility for keeping transmission rates low to all of us as individuals.

Of course, viruses have evolved specifically to take advantage of our social nature. They spread because we hate being alone.

Let's return to the vacation thought experiment using Kant's categorical imperative in the context of this new reality. Before, we determined that a vacation was morally justified because the world would be quite alright (at least in theory) if everyone took a vacation.

Now, we must take into account the non-zero possibility that you are unwittingly infected with coronavirus, asymptomatic as you may be. By traveling, you then run the risk of introducing the virus to the population of your destination as well as to the home communities of all your fellow vacationers. While the odds that you are infected today may be low, what world do we create when everyone – including those unwittingly infected – takes this action? Indeed, seemingly innocuous actions at scale produce a world in which the coronavirus growth rate stays high, and more people die.

Due to the deterministic nature of network effects and their blossoming causal chains, the downside risk is colossal irrespective of probabilities. Speeding in a car has a relatively high probability of leading to fatalities, but the downside risk is at least limited to a fairly small number of deaths. The odds that you are infected with coronavirus is relatively low, but the number of people you could effectively kill by being infected and careless with your actions is unbounded. My friend and colleague Josh Liebow-Feeser described this well:

At current growth rates (15% day over day), anyone transmitting the disease to a single person is, in expectation, responsible for 100 infections within 33 days. In expectation, that will result in two deaths, and that's only if we consider the first month. So even if the likelihood that you have the virus is very low, the expected value of the effects of your actions is still pretty serious.

With or without Kant's categorical imperative, this kind of risk assessment at the margins should make clear our moral obligation.

We are a social species, which makes these the measures we have to take uniquely difficult. Of course, viruses have evolved specifically to take advantage of our social nature. They spread because we hate being alone.

This is my reading of moral philosophy during a pandemic, but it's also a personal plea. Our situation makes increased isolation our very duty – to our friends and family, to the elderly and immuno-compromised, and to all of society. Every small action you can take now to limit your contact with others is an action that keeps hospital beds open and ventilators available. The sooner you take action, the greater your impact. If you can work from home, you have a moral imperative to do so. If you can cancel your travel, you have a moral imperative to do so. This extends all the way to cancelling small social gatherings and the frequency with which you wash your hands. Even if you feel no symptoms, you can contribute to keeping this crisis manageable by staying home now. Talk to your friends and family about the seriousness of these actions now, before the infections skyrocket further. They will pay dividends in human lives saved over the coming weeks and months. The best time to limit your contact with other people was yesterday, the second best time is now.

Thanks to Josh Liebow-Feeser and Alex Bitterman for contributing perspective and ideas.

Kasey KlimesComment
An Augmented Mind: Designing a Knowledge Base with Notion
memex.jpg

In 1945 Vannevar Bush proposed the Memex, a machine that would provide an "enlarged intimate supplement to one's memory" by compressing and storing all of one's books and records. Fast and flexible recall of information would be assisted by the interconnection of "associative trails". In effect, the organization of information in the machine would reflect the associative patterns of our own thought. As Bush argued,

"The human mind... operates by association. With one item in its grasp, it snaps instantly to the next that is suggested by the association of thoughts, in accordance with some intricate web of trails carried by the cells of the brain. It has other characteristics, of course; trails that are not frequently followed are prone to fade, items are not fully permanent, memory is transitory. Yet the speed of action, the intricacy of trails, the detail of mental pictures, is awe-inspiring beyond all else in nature."

Despite the 75 years and countless innovations we've had since Bush's call, most information systems still don't reflect the mind's associative process. They enforce rigidly hierarchical information architectures, only support one-way links, and completely ignore the importance of the relationships between pieces of information. We are up to our necks in note-taking tools, but we lack thinking tools that help us make sense of that information.

As a researcher I find this especially frustrating. The tools at our disposal for making sense of avalanches of information are disappointing at best. Fortunately, Notion has come along and built a tool that enables some degree of thinking in the spirit of Bush's Memex.

This Notion block contains a template of my personal knowledge base. I think of it as a flexible framework for structuring insights into a network that allows me to easily explore the relationships between them and ultimately synthesize them into new ideas or a better understanding of the world. I consider it a secret weapon (that everyone should have)!

Why Notion?

Notion has a few unique capabilities that make it extremely well-suited for a knowledge base.

Two-Way Links

A mind produces a resource, a resource is produced by a mind

A mind produces a resource, a resource is produced by a mind

My knowledge base takes advantage of Notion's relational database functionality, which is super handy for knowledge bases because it reflects a basic characteristic of information that most other systems ignore:

If A is related to B, then B is also related to A.


Ted Nelson saw the power of two-way links in the 60's but his vision was eclipsed by Tim Berners Lee's World Wide Web of one-way links.

For example, I have a table for Minds (writers, thinkers, etc.), and a table for Resources (books, articles, podcasts, etc). In the Minds table we may have Christopher Alexander, who wrote A Pattern Language, which appears in the Resources table. If we list A Pattern Language as a resource related to Christopher Alexander in the Minds table, then Christopher Alexander will simultaneously appear as a mind related to A Pattern Language in the Resources table. Two-way links are the perfect default in a knowledge base because relationships between information are inherently reciprocal.


Many-to-Many Relationships

An author may write many books. A book may have many authors.

An author may write many books. A book may have many authors.

An author may write many books. A book may have many authors.

Furthermore, most information does not actually conform well to hierarchical tree-like structures. There can be relationships all over the place.

A can be related to B and C, and C can be related to A and D.

Since Notion databases allow for multiple blocks within a single cell, we can create many-to-many relations. Christopher Alexander also wrote The Timeless Way of Building, and Notes on the Synthesis of Form. Each of those books appears as a block inside the single cell that contains all the resources related to Christopher Alexander. Conversely, A Pattern Language was co-authored by Sara Ishikawa and Murray Silverstein, so they may each appear as blocks inside the single cell that contains all minds related to A Pattern Language. These many-to-many two-way links form the basic relationships for all information in the knowledge base.

How It's Structured

Every table is linked to all the other tables.

Every table is linked to all the other tables.

These many-to-many two-way links govern the relationships of information across five tables.

Minds

This is a table of individuals who have generated important knowledge. Most in my knowledge base are authors, but some are practitioners, speakers, and a few of my most insightful friends.

Resources

This is a table of books, blog posts, podcasts, videos, images and more that serve as primary resources for my note-taking. My Notion web clipper defaults to dumping content from the internet into this table.

Insights

This is a table of distilled insights, a term I use loosely to describe anything that gives me an "aha!" moment. It may be a statistic, a historical fact, an explanation of a useful concept, an aphorism, a provocative question, a scientific or philosophical theory, whatever. It's a unit of knowledge or wisdom, and the block usually contains an expansion on the insight.

Synthesis

This is a table of my own in-progress writing. It's where insights come together to form (hopefully) new perspectives.

Tags

This is a table of topics/subjects, e.g. "Augmented Reality", "Complexity Theory", "Cities".

Each table has a primary column for its main attribute followed by four more columns for attributes linking it to the four other tables. If it were visualized graphically (more on that in a moment) it would look like a crazy web, but in the tables it's all quite neat and tidy.

Why It Works

A few things happen when information is structured like this.

First, patterns emerge. From the Tags table I can easily see all the insights related to a given tag. This often means I can see a new insight next to a topically-related insight I captured months ago and forgot about, but that now projects a new meaning when considered in juxtaposition with the new insight. The natural bundling of topically-connected insights sets me up for seeing connections between concepts I may have otherwise missed.

It turns out this is a fantastic way to practically auto-generate concepts for new ideas (which of course produces new blocks of writing in Synthesis related to those previously isolated insights). Sometimes I don't even start with writing; I simply create a new block in Synthesis and link a bundle of insights and resources to it that will form the basis of an article to write later.

There may be millions of fine thoughts, and the account of the experience on which they are based, all encased within stone walls of acceptable architectural form; but if the scholar can get at only one a week by diligent search, his syntheses are not likely to keep up with the current scene.
— Vannevar Bush, As We May Think

Second, basic retrieval of information becomes easier. I have terrible memory, but I have to remember something to retrieve a piece of information from the knowledge base – the interconnected tables provide multiple paths to get there.

For example, it frequently happens that I have only a vague recollection of an insight relevant to something else I'm studying. Perhaps I recall it was a theory that explained the systemic advantage of democratic decision-making, but I can't recall the name or anything else about it. None of my search-queries are finding it. However, it was an insight about political philosophy – so I need only look at the insights related to "Political Philosophy" in the Tags table to find it! Alternatively, if I only remember that it was a theory by Marquis de Condorcet, I can look under the insights related to him in the Minds table. (Ah, yes, the Jury Theorem!) Many relations across tables reduce the chances of a relevant insight becoming buried in the knowledge base. If you've ever experienced the magic of looking up an esoteric library book only to find a dozen related titles next to it on the shelf then you understand the value of this proximity.

Third, this system basically auto-generates summaries of every book I read. If I want to refresh my memory of Juhani Pallasmaa's Eyes of The Skin, all I need to do is go to that book in my Resources table and review all the important insights I extracted from that text. I keep photos of the original book pages inside the insight block so that I can go back to the exact page an insight came from and review the original context if I want to go deeper.

We could think about the tables as a sequence from minds to the resources they create, to the insights we extract, to the synthesis they produce.

We could think about the tables as a sequence from minds to the resources they create, to the insights we extract, to the synthesis they produce.

What's Missing

This is not, however, a perfect system. There's some yet-to-be developed functionality I think my knowledge base system really needs to reach its full potential.

Automatic Second-Order Relations

Links don't currently proliferate through the entire knowledge base:

If A is related to B and B is related to C, then A and B have a first-order relation while A and C would have a second-order relation.

There is currently no ability to automatically generate that second-order relation in the same stroke as the first-order relation. It must be done manually. This creates some overhead, though I find it worthwhile.

If links to other tables are made from the Synthesis table (as in Example #1), then second-order links must still be created between the other tables.

If links to other tables are made from the Synthesis table (as in Example #1), then second-order links must still be created between the other tables.

I've made this visible with Example #1 as shown in the template. I linked Synthesis Example #1 to Insight Example #1, Resources Example #1, Minds Example #1, and Tags Example #1 all from the Synthesis table. That means that in each of the other tables you will see the relation back to Synthesis Example #1, but you will not see Resources Example #1 in the Insights table, or Minds Example #1 in the Tags table. In order to have Example #1 proliferate completely throughout the knowledge base I have to go through each table and manually link the remainder of the attributes (as I have done with the Example #2 set).

Why does this matter? Well, one obvious reason is simply more efficient maintenance of the knowledge base. As it is, my knowledge base is perpetually incomplete.

The second, less obvious reason is that automatically generating second-order relations creates more opportunity for emergent relationships to appear. Second-order relations are inherently less obvious that first order relations, meaning that the automatic juxtaposition of insights with second order relations holds even more potential for big "aha!" moments. A good thinking tool puts non-obvious concepts in conversation with one another, and forces the user to consider their relationship.

Graphical Information Mapping

Visualizing relationships can make abstract relationships more legible

Visualizing relationships can make abstract relationships more legible

As I've pointed out, the real strength of this system is that it allows non-obvious relationships between information to emerge so that my brain can more easily connect the dots. Again, it’s not just a note-taking tool, it’s a thinking tool. Today, it does that better than any other system, but I am very much a visual thinker.

Actually seeing the relationships across units of information would provide a whole new way for patterns to emerge.

What if I could visualize my knowledge base as a network graph? Perhaps I'd see relationships I may otherwise miss, or perhaps an unexpected cluster of insights could direct my attention to something important emerging in my research. I've always wanted a personal knowledge base that represents and embeds information in the way GIS does, because our brains really like spatial metaphors. What does the city of economics look like, and where are the roads to the city of psychology? Where does the neighborhood of Keynesianism fit in relation to the neighborhood of Hayek? Hey wait how did Daniel Kahneman get here? (You get the idea). Different views of the same information provide new ways of seeing.

Conclusion

Notion is great at providing different views for the same set of information, so I could see graphical information mapping as a future development. Second-order relationships may be a bit obscure (and complex) to develop for the average user, but perhaps the forthcoming API will make it possible with some tooling. I have a deep admiration of Notion for staying true to the principles that made this system possible for me. They even have a commissioned portrait of Doug Engelbart in their office!

Overall I find this system to be a massive evolutionary leap from my old messy systems of text file notes in rigid hierarchical file structures with one-way links. I think Vannevar Bush would agree. If you're looking for an effective knowledge base system, duplicate this template to your Notion workspace and give it a spin! I hope it can be useful to you as well.

Kasey KlimesComment
A (Constructive) Critique of Data as Labor

The Quality Problem

The Inequality Problem

The Meaning Problem

The Disaggregate Value Problem.

14377164540_454c0f577b_o.jpg

In March I attended the RadicalxChange conference in Detroit, where “data as labor” was celebrated as a core tenet of a nascent social movement. This idea gained traction following Jaron Lanier’s 2013 book Who Owns The Future?, which proposed a Ted Nelson-inspired digital infrastructure for micropayments on the internet. In such a system, you could be directly compensated for the value created by your data. The idea has been explored further in Lanier’s collaboration with Glen Weyl, which led to a chapter in Radical Markets on the subject.

Contrary to the norms of the internet for the last couple decades, the new radical liberals claim, information should not be free. Some have even envisioned “data strikes” as a tactic towards this end.

I sympathize with this perspective. Surely if our data is generating wealth, those who produce the data should see commensurate compensation . As Lanier points out, there is no real technological innovation in a platform like Facebook, and without our data it would be worthless.

What most impressed me about the community that convened at RadicalxChange — aside from the wide ranging brilliance and lucid visions of its attendees — was its openness to self-critique and its rejection of ideological dogma.

As a contribution to that emerging cultural norm and in the hopes that we can get closer to a viable proposal, I’d like to share some concerns I have with the data-as-labor argument as I have seen it laid out. In the spirit of constructive critique I’ll outline them here.

The Quality Problem

One core argument made by the data-as-labor movement is that paying for information will incentivize higher quality information. That is true, but only if the compensation is directly linked to the quality of that information. Unless we adequately quantify the quality of data, compensation for data creates incentives to flood the network with high quantities of low-quality data. People would game the system. It is not obvious how this would work. How does one measure the quality of a restaurant review in a way that can’t be gamed? Even if markets were set up so that different platforms could bid for restaurant review data, they would need to be able to determine their quality in a manner that scales without introducing new biases.

(It's worth noting that a similar disconnect occurs today in news media – sensationalism pulls at least as much revenue as deep investigative journalism – with similarly detrimental results to the information ecosystem.)

The Inequality Problem

The data-as-labor movement tends to use the value created by training data for algorithms as a preferred example. Perhaps the most common (and value-generating) kind of AI today is a recommendation algorithm, like those that recommend products on Amazon. They are trained by exhibited preference data, e.g. the person who bought running shoes also looked at sunscreen. In an egalitarian world this would be fine, but in a world of multi-dimensionally quantified value and wealth inequality, isn’t the preference data of wealthy people worth more than the data of low-income people simply by virtue of their spending power? And if that’s the case, would wealthy people not be paid more for what is otherwise the same data? How would such a system avoid perpetuating or even exacerbating existing inequalities?

The Meaning Problem

This issue is more philosophical, but I think it has major implications for the human psyche. In a world where every action has an associated data artifact for sale, are we not reducing human existence to a never-ending transactional nightmare? Does the data of who and how I love have a price tag on it? Does that change the way we think about love? Community? Meaning? What if a world of data-as-labor looks like hyper-neoliberalism, in which anything and everything is commoditized? Maybe we don’t want to economize metaphysical values.

The Disaggregate Value Problem

What if all of these problems are the cost of a program that ultimately isn’t worth much in the disaggregate? No one seems to know how much disaggregate data would be worth in a market-based data ecosystem. What if my data is only worth $20 a month? That nominal amount simply isn’t enough to rebuild a middle class, as Lanier suggests it might, nor is it enough to warrant the major infrastructural changes required to create such a system. While some project the returns may increase over time as the value of data is realized, this remains one of the biggest unknowns of data-as-labor and perhaps the most clear gap in the underlying argument.


I've pointed out the problems I see with the data-as-labor solution; it requires quantifying data quality, it might exacerbate inequality, it might make us go crazy by putting a price tag on literally everything, and for the average person the payout may be little more than pocket cash. On top of all that, it's just a really complicated idea to implement.

For example, not all data is the same. Nor is it always clear that the data itself is the valuable asset this model assumes. In some cases, such as the training data for algorithms that go on to automate some value-generating process, there is clearly value in the data. In other instances, such as for digital advertisers, the data is merely a conduit for targeting the right ad at the right person – ultimately the targeted individual's attention is the valuable asset. Data brokers could have all of our data, but if we never use the internet to see an ad it's not worth anything to advertisers.

I appreciate the appeal of a world in which every individual data point has an associated value that modulates according to context and makes its way back to its originator every time that value is realized. As I think Lanier admits, however, this level of granularity and traceability basically requires rebuilding the internet. Even if that infrastructure were built, the system would demand a massive amount of overhead for a payout that, again, may not amount to much.

The big upside to the granularity and traceability of the data-as-labor solution (which includes paying for data as well as being paid by it) is that it could become more widely feasible for creators like authors, artists, and musicians to make a living off the intellectual property they produce. Lanier makes the case that building a system for compensation of the activities that are uniquely human will buffer us against the tide of automation. Whether or not that's true, I'm content to accept that a world that incentivizes more creative and intellectual output is a more beautiful and interesting world to live in.

In a later post I'll explore some ideas that attempt to ameliorate the problems listed here while preserving this upside. For now I’d love to hear how others interpret these problems (if they are indeed problems) and if there are any dynamics my thinking may have missed.


Thanks to Nick Vincent for helping me refine some of these points!

Kasey KlimesComment
Humans & Capital: Dynamics of scale in social systems

Quantity has a quality all it’s own.
–Napolean (or maybe Stalin, we’re not sure)

 
CFM32-01.png
 

A strange thing happens when human systems grow. They have a tendency to be guided less by relationships between humans and more by relationships between capital. At scale, capital is a standardized and reified token of trust that doesn’t require individuals to know each other as they would have in small, pre-monetary tribal societies. Capital is well-suited for large-scale cooperation, but this cooperation comes at a cost. This is my sketchpad for one possible way to think about human systems and capital. The basics are captured in two interrelated dichotomies:

Human cooperation has diminishing return at scale.

Capital cooperation has increasing returns at scale.

and

At small scales, capital is a tool for humans.

At large scales, humans are a tool for capital.

Human cooperation has diminishing returns at scale.

I arrived at a party unfashionably early last night, and noticed what happens to social dynamics as group size grows. A conversation between four people was maintained effortlessly. As other guests arrived, however, engaging everyone in a single conversation became difficult and unnatural. Little factions of conversation broke off – the latest gossip in the kitchen, a political debate on the patio, intimate flirtation in the hallway – until the party was composed of lots of little conversation groups.

It turns out social scientists have studied this phenomena. Researchers recently determined that the maximum group size for interactive dialogue is four people. Any larger than 4 people and the mode of conversation becomes a serial monologue in which dominant speakers emerge. In other words, a conversation with a larger group isn’t so much a conversation as individuals speaking at a group in turn. Without active facilitation the conversation naturally splinters into smaller groups to maintain interactive dialogue.

This splintering is the result of our limited cognitive capacity. You can use Metcalfe’s Law to understand how larger groups spiral into complexity by considering how many unique relationships are formed by increasing group size. For every person added to the group, the number of unique relationships increases as a function of n(n – 1)/2. A group of four people has 6 unique relationships, while a group of five people has 10 unique relationships (see the network diagram above).

Ten unique relationships is more than our working memory can manage. Cognitive psychologist George Miller determined that the number of objects we can keep in our minds at a given time is seven, plus or minus two. If your relationship with each individual is an object to be maintained in working memory you can see how your cognitive capacity is quickly overwhelmed by even slightly larger groups. Interactive communication deteriorates with scale.

dunbar.jpg

At larger scales and longer timelines, the Dunbar number – 150 people (or at least somewhere between 100 and 230 people) – suggests a cognitive limit to the number of human relationships that can be adequately maintained in a community before social ties break down.

150 is the standard population size of neolithic farming communities, Roman armies, and Hutterite and Amish communities today. It’s about the biggest a group can get before people start becoming strangers to one another. Much like the researchers studying conversation dynamics at scale, anthropologist Robin Dunbar showed how this limit to community size is a function of our innate cognitive capacity.

Human communication and the relationships they compose break down with scale. It’s only through intersubjective narratives–like financial relationships–that stable cooperation can occur beyond the Dunbar number.


Capital cooperation has increasing returns at scale.

Unlike humans, capital cooperates more easily at larger scales.

IMG_20190419_112349.jpg

A study by economist Gabriele Camera of Chapman University found that group size had a major influence on cooperation. When two players in a game operated on a non-monetary system of trust–in which players trust that favors given will be returned by the other player–players helped one another out 71% of the time. In groups of 32 people playing the same trust-based game, this reciprocity fell to 28%. This non-monetary trust-based system quickly deteriorated at scale.

When the game incorporated a monetary system in which favors were bought and sold with currency (rather than simply trusting that other players will reciprocate), the relationship with scale flipped. Small group cooperation dropped by 19%, whereas people in large groups cooperated almost twice as frequently than they did without the monetary system. Increasing scale shifts effective relationships from trust in individuals to trust in currency.

Unlike human communication and relationships, capital is a more efficient mode of cooperation as the system grows. Efficient cooperation at scale produces increasing returns at scale when the system is a company (and in plenty of other cases when it isn’t). This is closely related to economies of scale in neoclassical economics. It’s cheaper to be bigger.

The expanding scale of globalization has enabled a compounding effect for capital. Scale means access to more markets, more demand, more supply, and more return on capital investment. Superstar effects are accelerated by network effects and regulatory capture, producing exaggerated power law distributions in which the big gets bigger. Large companies absorb small companies and get bigger still.

In particular, the tech sector is the beneficiary of zero-marginal cost business models. It costs roughly the same to develop software for 100 paying users as it does to develop software for 1,000,000 paying users. It also requires roughly the same number of employees, thereby bypassing the diseconomies of scale caused by (human) cooperation costs that arise in other industries.

Capital has its own organizational logic. This is why Marxists call for working class solidarity and the capitalist class doesn’t need to.

At small scales, capital is a tool for humans.

This is immediately apparent through the frictionless transactions of our daily lives. My neighborhood grocer stays in business because my neighbors and I need food. The owner takes care of his family with the capital flowing from us to him. He invests in his businesses and gives his nephew a job. He pays taxes that go into public infrastructure so people can get to his business. He spends that money at other businesses and the cycle continues.

At small scales, economic development is real and it works. When capital is shared and power differentials are minimal, the free exchange of labor and capital creates opportunities for improved well-being.

At small scales, money is a token of trust exchanged face to face. Money facilitates cooperation and competition (which, when all players obey the rules of the game, is simply a productive form of cooperation for solving certain problems). It’s a tool for achieving mutually desirable goals, for facilitating optimism that tomorrow can be better than today, and often for delivering on that promise.

At large scales, humans are a tool for capital.

Capital, however, always wants to grow. It is blind in its desire to grow–it pays no attention to how big it already is. It knows only that growth is good. When there is an opportunity for capital to grow, it is capable of mobilizing vast swaths of the planet’s population to make it happen. Even if the CEO of the world’s largest corporation decided his company was large enough didn’t need to get any bigger, the investors would revolt and the board would have him replaced overnight. All of this human activity would be animated by capital’s need to grow. We unironically call the value of humans to capital accumulation human capital.

In Sapiens, Yuval Noah Harari explains how wheat conquered the planet, spreading from a tiny area of the middle east to the entire globe.

Wheat did it by manipulating Homo sapiens to its advantage. This ape had been living a fairly comfortable life hunting and gathering until about 10,000 years ago, but then began to invest more and more effort in cultivating wheat. Within a couple of millennia, humans in many parts of the world were doing little from dawn to dusk other than taking care of wheat plants. It wasn’t easy. Wheat demanded a lot of them. Wheat didn’t like rocks and pebbles, so Sapiens broke their backs clearing fields. Wheat didn’t like sharing its space, water, and nutrients with other plants, so men and women labored long days weeding under the scorching sun. Wheat got sick, so Sapiens had to keep a watch out for worms and blight. Wheat was defenseless against other organisms that liked to eat it, from rabbits to locust swarms, so the farmers had to guard and protect it. Wheat was thirsty, so humans lugged water from springs and streams to water it. Its hunger even impelled Sapiens to collect animal feces to nourish the ground in which wheat grew. 

Despite the care and labor, wheat did us few favors in return.

The body of Homo sapiens had not evolved for such tasks. It was adapted to climbing apple trees and running after gazelles, not to clearing rocks and carrying water buckets. Human spines, knees, necks, and arches paid the price. Studies of ancient skeletons indicate that the transition to agriculture brought about a plethora of ailments, such as slipped disks, arthritis, and hernias. Moreover, the new agricultural tasks demanded so much time that people were forced to settle permanently next to their wheat fields. This completely changed their way of life. We did not domesticate wheat. It domesticated us. The word “domesticate” comes from the Latin domus, which means “house.” Who’s the one living in a house? Not the wheat. It’s the Sapiens. 

In 1982 artist Agnes Denes was commissioned by New York City’s public art fund to plant and harvest wheat in downtown Manhattan. The land was worth $4.5 billion. The piece was intended as social commentary for our misplaced priorities, contrasting o…

In 1982 artist Agnes Denes was commissioned by New York City’s public art fund to plant and harvest wheat in downtown Manhattan. The land was worth $4.5 billion. The piece was intended as social commentary for our misplaced priorities, contrasting our perspective on food versus real estate, but perhaps the wheat is better thought of as a parallel to capital than a foil.

The relationship between humans and wheat is parallel to the relationship between humans and capital. We did not domesticate capital. It domesticated us. Psychological studies have found that money can improve subjective well-being – but only at small scales. Past ~$75,000/year, more money has no effect on individual happiness. Economists call this the law of diminishing marginal utility; as supply grows, the marginal value of each unit (say, of dollars) falls.

Yet diminishing marginal utility does nothing to capital’s desire to grow. If it can maximize growth by buying favors from politicians, it will do so to the best of its ability. If it can pay workers less and still get value out of them (say, by acquiring or colluding with the competition for labor), it will.

This pattern is not a matter of people being greedy. This is the result of the impregnable incentive structures created by systems of capital at scale. In this system, the human is a conduit for expansion. Jeff Bezos is as much a tool for capital as the Amazon warehouse worker he employs.

At the scales of global neoliberalism, humans don’t leverage capital. Capital leverages humans.


None of this is to suggest that large scale systems are inherently bad. We need large scale cooperation (likely facilitated through the relationships of capital) in order to tackle global issues like climate change or antibiotic resistant germs. What’s important to remember is that the dynamics of cooperation and the logic of capital changes at scale. This phenomena has inherent dangers that can produce perverse outcomes if not properly taken into account.

Thanks to Alex Deaton for providing several of the excellent sources in this post!

Kasey Klimes Comment
Nobody to Shoot
20190129_dust_storm_bowl.jpg

We are reminded of the quandary of the tenant farmer in John Steinbeck’s The Grapes of Wrath, who confronts a tractor driver on the verge of bulldozing his shack. The farmer threatens to shoot the driver, who after all looks to be the (agentive) source of his domination. Nevertheless, the driver strenuously objects:

It’s not me. There’s nothing I can do. I’ll lose my job if I don’t do it. And look – suppose you kill me? They’ll just hang you, but long before you’re hung there’ll be another guy on the tractor, and he’ll bump the house down. You’re not killing the right guy.

‘That’s so,’ the tenant said. “Who gave you orders? I’ll go after him.’ ‘You’re wrong. He got his orders from the bank. The bank told him, “Clear those people out or it’s your job.”’

‘Well, there’s a president of the bank. There’s a board of directors. I’ll fill up the magazine of the rifle and go into the bank.’ The driver said: ‘Fellow was telling me the bank gets orders from the East. The orders were: “Make the land show profit or we’ll close you up.”’

‘But where does it stop?’ Steinbeck has his farmer ask the driver of the tractor. ‘Who can we shoot? I don’t aim to starve to death before I kill the man that’s starving me.’ ‘I don’t know,’ the driver replies. ‘Maybe there’s nobody to shoot’

Hayward, C., & Lukes, S. (2008). Nobody to shoot? Power, structure, and agency: A dialogue. Journal of Power1 (1), 5-20.


Kasey KlimesComment
Feedback Loops of Thought & Power
 
IMG_20190307_231811_2.jpg
 

Thoughts are exogenous. What we think about from moment to moment is influenced–consciously or subconsciously–by our job, our friends and family, our education, our past experiences, the culture we engage with, the language we speak, the movies we watch, the websites we visit, the art we view, the music we listen to, and so on and so on. Our subjective experience of the world is a vector of force on our minds.

Of course, thoughts are also a vector of force on the world. Every experience I just listed is the product of someone else’s thoughts and how they chose to convey them. By reading this post, you are accepting the influence of my thought on your thoughts. Steven Pinker calls this is the essence of communication; the effective transmission of thoughts between brains.

At the scale of society this back and forth of force creates a big feedback loop. The model depicted above is clumsy, but it’s my best attempt to tie together multiple theories of power into a coherent structure with “thought” as the subject of interest. Those theories are semiotics, media theory, neo-marxism, and post-structuralism.

Representation :: Semiotics

“If thought corrupts language, language can also corrupt thought”

George Orwell, Politics and The English Language, 1946

Representation of thought takes the form of words, phrases, images, sounds and symbols. Orwell emphasized that power over language (or semiotics more generally) is about as close as one can get to power over thought itself. Even within our minds we cannot escape the boundaries of the symbols we use to express ideas – an abstract concept without a name or words to describe it isn’t a concept at all. A 2001 study found that English speakers and Mandarin speakers conceptualize time differently as a byproduct of their respective linguistic structures. Findings like this support the Sapir-Wharf hypothesis, which suggests that our interpretation of reality is heavily influenced by the language we speak.

Media :: Media Theory

“We shape our tools and thereafter our tools shape us.”

Marshall Mcluhan, Understanding Media: The Extensions of Man, 1994

Representations are conveyed at scale through media, the forms of which have influence over the thoughts conveyed through them. It’s no coincidence that Facebook became a hotbed of political activity in 2016 even while Instagram–under the same ownership–never gave the slightest whiff of election year drama. Instagram is, however, overhauling the design of our restaurants and the way we eat. Different forms of media give rise to different expressions of influence on our thoughts. Media is a form of power, as Fox News, Hollywood, and the rise of social media celebrities make clear. A 1978 Canadian study found that children exposed to a toy commercial chose to play with a mean boy who had the toy over a nice boy who didn’t have the toy. Children who didn’t see the commercial preferred playing with the nice boy despite his lack of toys.

Culture :: Neo-Marxism

“Ideas and opinions are not spontaneously "born" in each individual brain: they have had a centre of formation, or irradiation, of dissemination, of persuasion-a group of men, or a single individual even, which has developed them and presented them in the political form of current reality.”

Antonio Gramsci, Prison Notebooks, 1929-1935

Media exerts force on our norms of social relation, our culture. Antonio Gramsci proposed that power was exerted through cultural hegemony, a dynamic in which the worldview of elites becomes the culturally accepted norm. Margaret Thatcher’s famous Gramscian defense of market fundamentalism became a slogan; “There is no alternative”. A parallel concept is the Overton window, in which political actors struggle to define the bounds of what policy ideas are considered plausible and mainstream.

 
urn_cambridge.org_id_binary-alt_20170126184834-48637-optimisedImage-S1537592714001595_fig1g.jpg
 

Of course, there is a relationship with material power that isn’t fully captured by the model. A 2014 US study of thousands of policy opinion polls between 1981 and 2002 found that public support among median-income Americans for a policy had no correlation with the likelihood of that policy passing as legislation. If 100% of median-income Americans supported a policy, it had only a ~30% chance of passing as legislation. If 0% of median-income Americans supported a policy, it still had a ~30% change of passing as legislation. In contrast, the preferences of those in the top 10% of income earners were well-reflected by legislation.

Epistemology :: Post-Structuralism

“There is no power relation without the correlative constitution of a field of knowledge, nor any knowledge that does not presuppose and constitute at the same time power relations”

Michel Foucault, Discipline and Punish, 1977

As the post-structuralists point out, the context of our culture dictates our modes of knowledge; the epistemology of the enlightenment was a product of Western culture. The cultural force of modernism reinforced and expanded the primacy of positivism just as post-modernism gave rise to post-positivism (and vice versa). Foucault saw power wielded by academics who held sway over our notions of truth and over which methods of arriving at truth would be deemed legitimate. Just as semiotics set the bounds of what thoughts we can express, our available epistemologies set the bounds of what thoughts we can encounter. As Hume pointed out, the descriptive models (produced by an epistemology) of how the world is find themselves swiftly re-employed as normative claims of how the world ought to be. The way we build knowledge informs the way we think the world should be, thereby structuring building blocks of power.


Each phase of this cycle–representation, media, culture, and epistemology–informs the phase after it. Each phase shapes, constrains, expands, or manipulates the thought that passes through it. Some of this is done with intent, most of it is probably not (here is a great debate on agent-centric vs structural models of power).

Of course this model is massively oversimplified. There are clearly recursive loops between phases and with systems external to the model (again, I’m bringing in Neo-Marxism but not talking about resource distribution?)

But I’m not trying to create an accurate map of reality here. I’m trying to reconcile multiple theories of influence. As political philosopher Hanzi Freinacht points out, thinking “both-and” is a philosophical escape hatch from both the warring grand-narratives of modernism and the self-immolating deconstruction of postmodernism. If we can begin to synthesize disparate theories of social reality, maybe we can find truth in the common ground we didn’t know we had all along.

Kasey KlimesComment
What the hell is water?
MothBabyDiv.jpg

I attended Montessori schools as a kid. For those unfamiliar with the teaching philosophy, it’s less about “teaching” in any formal sense and more about providing the space and tools for exploration. The class room was full of blocks, bells, beads, and books. As kids we were pretty much free to chart our own path of discovery. Teachers were there to support and facilitate our curiosity.

It is no doubt faster to simply rattle off facts in a curriculum to a class of fidgety 7-year olds and get on with it. Instead, I was encouraged to build, experiment, dissect, break things, consider new perspectives, and fail as much as need be. I’m convinced this is a superior model for deep learning. Unfortunately most of our lives are not spent in such a free and playful environment.

So I’m creating one for myself.  This digital space is for my humble attempts to make sense of a complex world (for example, a world that now includes bizarre concepts like “digital space”). For years I’ve kept this mind-play in notebooks and text files on my computer. Now I’ll put them here. I’ll think out loud while digging for patterns. I’ll mash concepts together and see what they produce. I’ll attempt to point a flashlight at the invisible structures of our collective realities. Naturally, I’m trying to articulate reality from inside reality. To torture David Foster Wallace’s joke, I am a fish contemplating water.*

Technically it’s a blog, but I’m calling it Notes to emphasize that most of the content here will not be fully-formed, and that I’m writing it down mostly as an exercise in thinking. That choice is also to remind myself not to get too precious about this digital scratchpad. I’m not trying to win any writing awards, but I do aspire to be ever-more philosophically promiscuous. That means wading into territory in which I can’t be confident I have the whole picture, but doing my best to wrestle with ideas anyway. I will almost certainly make statements that are wrong, or that unintentionally misinterpret the ideas of others.

That’s also why I’m making it public; I hope I might gain from the perspectives of people who better understand the spaces into which I’m exploring, or who can shed light on the gaps in my thinking. If that describes you please read on and reach out.

I’m fascinated by subjects like heterodox economics, evolutionary psychology, humanist technology, spatial sociology, mechanism design, systems theory, semiotics, epistemology, and political philosophy. If that sounds like a grab bag of overlapping circles of abstraction it’s because it probably is. If you stare intensely at a range of subjects in the social sciences long enough, common patterns begin to emerge across them. These patterns are what occupy my mind whenever I’m not being paid to think. I think they offer clues to humanity’s big questions, and new lenses through which to see the challenges that face us.

I’ll do my best to include diagrams and images to convey thoughts because I’ve never found linear text captures multi-dimensional concepts gracefully on its own. I’ll try to lean heavily on metaphors and examples, and I’ll probably over-explain things in my attempt to reduce transmission loss between my brain and your brain.

If all goes according to plan, it’s going to get weird.

/K

*I’ve never read DFW, but heard this joke from his 2005 commencement speech at Kenyon College.

Kasey KlimesComment
The User Experience of American Democracy

I have an admission to make: I can’t keep up with politics.

Sure, I have a general sense of what is going on, but the sheer scale and complexity of it all is utterly unapproachable. The last voter guide I received in the mail was over 200 pages long. I feel overwhelmed, and I have a degree in political science! To truly process in our information-soaked era demands not only constant attention to an avalanche of biased news, but a broad and deep understanding of policy implications and a supernatural ability to distinguish signal from noise in the chaos.

Plenty have been turned off to politics entirely. Only 37% of Americans could name their representative in a recent poll, while three-fourths of young adults couldn’t name a senator from their home state. Only 55% of voting-age Americans voted in the 2016 election. The popular media narrative blames our political apathy for allowing the politics of our government to move so far from the politics of the people it governs. Conventional wisdom says Americans just don’t care.

In user experience (UX) design this narrative is called “blaming the user” and it is the surest way to fail as a designer. The story of the apathetic voter is a well-worn trope, but what if Americans are simply alienated by bad design? When Thomas Jefferson argued that democracy requires well-informed citizens he probably feared a dearth of public information, but what happens when voters face information overload?

“…wherever the people are well-informed they can be trusted with their own government.” — Thomas Jefferson

Consider the number of political offices that the well-informed citizen is expected to follow. Thanks to the gargantuan size of the United States and the federalist system intended to connect people with government, Americans must keep tabs on a daunting array of offices. Each office is governed by a unique set of rules and endowed with a unique set of powers. Most of us are represented by a city council member, a state house representative, a state senator, a U.S. representative in the house, and two U.S. senators. That’s just the legislative branches. In the executive branches, voters must generally choose a mayor, a county executive, a state attorney general, a treasurer, a secretary of state, a governor, a lieutenant governor, and the president of the United States. If you’re counting, that’s roughly 14 offices with plenty more in judgeships, public defenders, transit boards, and local school systems.

By comparison the citizens of Denmark — a country where voter turnout regularly surpasses 85% — vote for about 5 offices (if you include their vote in the European Union).

The electoral college map if “Did not vote” had been a candidate in the 2016 election. Source

Still, the well-informed citizen needs to know more — each of those races may have candidates from two or more parties. In the 2018 election, there were over 12,400 candidates on ballots across the country. It may appear that our two-party system simplifies things for the American voter. What could be simpler than two choices? In actuality, the system encourages politicians with a wide range of policies to pack themselves uncomfortably into one of two parties. In countries with parliamentary governments, party label can be a useful shorthand for policy platform. Less so in America, where politicians more commonly vote with the opposing party on key issues.

This broad obfuscation of policy leads not to the best politicians, but rather the representatives who stand out amidst the chaos with romantic backstories and charming stage presence on television. The differences between President Obama and President Trump are many, but both can be described as cults of personality in their own right. The President is elected not just to execute the will of the people, but to embody the national spirit. Celebritydom and the aura of it has been winning Presidential campaigns since JFK. Our politicians must have starpower — by design.

Big umbrella parties make for uncomfortable bedfellows. The real political battles often play out in primary elections — such as the recent nomination of Alexandria Ocasio-Cortez — that are more consequential than the general election. As such, the well-informed citizen must be plugged in year-round.

There are many candidates vying for your attention in numerous races at your ballot box, but the well-informed citizen must keep tabs on ballot measures as well. California commonly has as many as 18 on any given ballot. Want unbiased information about them? Good luck. As we’ve been reminded in recent weeks, most information you’ll get about these propositions (or the candidates) is by a campaign or special interest group trying to get you to vote one way or the other. You’ll get more straightforward advice on a used car lot.

If American Democracy was a website.

Elections are not-so-conveniently sprinkled throughout the calendar. On top of national elections in November the well-informed voter needs to keep tabs on local and special elections that could occur at any time. Only 17 of the 50 states provide same-day voter registration, so if you’re not registered chances are you’ll need to handle that before you can vote. Every state has a different process for voter registration and voting.

Once the election is over, the well-informed citizen should follow the actions of congress to keep their representative accountable. The 114th congress introduced over 12,000 bills over the course of their two years in office, and the average length of bills has increased by over 600% since 1948. Their language, of course, is unintelligible to anyone without an advanced law degree.

We have reached a scale, volume, and pace in American politics that far surpasses our cognitive ability as a species to process without well-designed interfaces. The existing interface between the towering machinery of government and the people does the commonwealth few favors in managing that deluge of information.

To Signal From Noise

In January of 2018, amidst rising tensions with North Korea, residents of Hawaii awoke to an incoming ballistic missile warning that concluded, “This is not a drill.” For a full 38 minutes, 1.4 million people believed their lives would soon be over. They called loved ones to say goodbye. Some hid in storm drains.

Hawaii’s emergency alert system, featuring both the real and test ballistic missile alert options.

It turned out to be a false alarm. The culprit? Poor interface design in the state emergency alert systems, which made the real alert nearly indistinguishable from the intended test alert. A high risk system ignited pandemonium across an entire state because of a user interface that didn’t take care to distinguish a humdrum drill from the signal of impending apocalypse. The information was obscured, the user wasn’t paying complete attention, and chaos resulted. Sound familiar?

Design is often the challenge of organizing complexity into clarity. The human mind is powerful, but its ability to process information has clear limitations. Our capacity for processing large amounts of information is directly dependent on the organization of that information.

With patience and concentration, you can probably read the poem on the left, but it contains no more information than the neatly organized and punctuated version on the right.

Spring and Fall (1880) by Gerard Manley Hopkins, written using continuous script (left)

We do not live in a time short on well-designed interfaces for navigating complexity. Indeed, mission statements like “Organize the world’s information and make it universally accessible and useful” have produced the world’s most successful companies.

Democracy is messy, but does it have to be this messy? What would it look like for American democracy to have a well-designed interface? What would happen if the chaos of information about candidates, platforms, and bills were clear, simple, explorable, expandable, and comparable? It surely wouldn’t solve all our problems, but it could provide clarity for the many people alienated by the avalanche of biased and obscured information about our political process, policy, and those we elect to serve our common interest.

Design for America

Fortunately, some have seen this challenge to democracy and produced new interfaces for exploring election information. Perhaps the most ambitious is BallotReady, a nonpartisan and personalized guide to your ballot. BallotReady focuses its efforts on the local races and ballot initiatives for which clear, reliable information is the most difficult to find.

The lynchpin of success is trust. BallotReady’s team of researchers have an open and explicit policy on how they collect information from endorsers, boards of elections, and directly from candidates. All information is linked back to its original source for transparency. Issue stances are not taken from third-party news articles, and must be “succinct, specific, and actionable” — bypassing platitudes to focus on specific policy support.

The interface is intuitive on both mobile and desktop. The hierarchy of information prioritizes actionable information for voting, with a landing page that highlights the upcoming election date and the voter’s polling place before diving into expandable categories of federal candidates, state candidates, local candidates, judicial candidates, and ballot measures. Within each race voters can easily compare candidate stances on a wide selection of issues.

That information is only useful insofar as voters can recall it at the ballot box, so the interface invites voters to build their personal ballot as they explore and decide. The end product is a simple list voters can refer to in the voting booth.

Of course, an app can only go so far in addressing the need for clear, citizen-friendly experience at the interface of American democracy. My hope is that this is only the beginning for the interfaces we use to engage with government so that we may one day all call ourselves well-informed citizens. We need a fundamental overhaul of the election process. If Thomas Jefferson was right, democracy in the 21st century depends on it.

Kasey KlimesComment
Big salaries vote Republican, but high property values vote Democrat. Why?
1*IYdpQvBamyh4gpnF_icBsA.png

Imagine two households. The first household, the Millers, make a combined income of $100,000 a year–decent, livable, but modest compared to many of their neighbors. They bought their two-bedroom home ten years ago with an affordable mortgage. Over time, however, their property value has grown dramatically, and today is worth nearly $1 million.

The Smiths, on the other hand, make far more in annual income; over $250,000 combined. They also bought their house ten years ago, for $400,000. It’s a big house with four bedrooms, but its property value hasn’t changed much.

With this information alone we can make a pretty good guess as to where the Millers and the Smiths live, and how they vote.

Income is a disputed predictor of political behavior–whether it’s rich people tending to vote for the ‘traditional’ Republican or the popular narrative of low-income whites voting for Trump in 2016. A quick dive into county-level American Community Survey (ACS) and 2016 election data, however, supports the traditional narrative that the rich (still) vote Republican, but suggests that property values are a stronger predictor — in the opposite direction. The Millers probably voted Democrat, and the Smiths likely voted Republican.

A $10,000 increase in median household income is associated with a 3.4 point decrease in Democratic vote share, while a $10,000 increase in median property value corresponds to a 0.5 point increase in Democratic votes.

Population density, race, education, inequality (as measured by gini), household income, and property values explain about 62% of county-level results in the 2016 presidential election. The strongest predictors, perhaps unsurprisingly, were race and education.

Property value is a strong predictor of political behavior

Property value is a strong predictor of political behavior

What I think is surprising is the results of household income and property values. Though household income is more frequently discussed, the impact of property values was more than three times greater than household income! A $10,000 increase in median household income is associated with a 3.4 point decrease in Democratic votes, while a $10,000 increase in median property value corresponds to a 0.5 point increase in Democratic votes.

While property value may appear to be a proxy for the urban/rural divide (and to some degree it certainly is), the model controls for population density alongside the other variables mentioned. According to my results, population density has a statistically insignificant relationship with voting behavior (though it’s possible density is a better predictor at more localized units of geography).

The relationship between property value and voting behavior is visible when mapped. Short of vote margins, property value is probably the clearest way to delineate the cultural concept of “The Coasts”.

1*GMl8W_c8tennRIZY7STCXQ.png

Aside from the less populous mountain region states, the property value map and the Democratic vote map share several geographic patterns in common. Notice the vertical band of red stretching from Texas to North Dakota, or the Appalachian mountain range, or the divide between coastal and inland Florida.

The same test on 2004 county presidential election and Census data of the same time period produces similar results — households with high property values generally voted for John Kerry, households with high incomes voted for George Bush. Like in 2016, the impact of property values on voting behavior overall was over three times greater than that of incomes. Between 2004 and 2016, however, the influence of both metrics in absolute terms appears to have increased by about 40%. The relationship with voting behavior is strengthening (meanwhile, the influence of race appears to have doubled and the influence of education has quadrupled since 2004 — are we becoming more predictable?).

So what does it all mean? I’m not an economist but I can think of a couple possibilities.

Hypothesis #1 — Voting as Tax Burden Calculus

Property tax is generally levied at the county level while income tax is most heavily levied at the federal level. This means the incentive to minimize tax burden could produce diverging voter behavior: high income places want to minimize income tax, so they vote for a Republican president.

The tax burden of high property value places won’t be influenced as directly by income-tax-focused federal policy, so voting Democrat for president (and perhaps more conservatively at the state and local level, *cough* California *cough*) might produce the same net tax burden results.

It’s possible that high property values produce left-leaning voters motivated by a similar tax burden calculus as high-income Republicans with low property values in Texas, Oklahoma, or Nebraska.

Hypothesis #2 — Voting as Property Value Boost

The relationship could also work in the other direction, with left-leaning voters effectively engineering high property values with their voting behavior. Democratic-voting places tend to have stricter development regulation, which limits housing supply and increases housing values.

Left-leaning voters whose wealth is mostly stored in their property have ample incentive to vote for local regulation that restricts further housing development. The White House isn’t very involved in this kind of regulation but local political tribe-identity ostensibly translates to national politics without much trouble.


My guess is both hypothesis #1 and hypothesis #2 are at play. Places with high property value vote Democrat, and Democratic voters create high property values. This is perhaps one sub-dynamic of a larger feedback loop that makes blue places more blue and red places more red.

I’ll be the first to point out that this is all somewhat back-of-the-napkin analysis. There’s plenty of room for further study to confirm or refute this relationship, and I encourage others to check out the data for themselves. Census data is available at nhgis.org, and 2016 election data is kindly available from Tony McGovern’s Github.


Below are the results of the multivariate linear regression if you want to dig deeper. Notice that contrary to popular belief, Republican-voting counties tend to have higher income inequality (according to the gini coefficient) than Democratic-voting counties when controlling for other factors.

Residuals: Min 1Q Median 3Q Max -32.586 -6.781 -0.530 6.358 43.100 Coefficients: Estimate Std. Error t value Pr(>|t|) (Intercept) 5.733e+01 4.015e+00 14.278 < 2e-16 *** p_degree 6.880e+01 3.319e+00 20.728 < 2e-16 *** p_black 2.989e+01 2.508e+00 11.915 < 2e-16 *** p_white -2.816e+01 2.329e+00 -12.093 < 2e-16 *** p_hisp 1.923e+01 1.364e+00 14.097 < 2e-16 *** p_asian 5.528e+01 1.066e+01 5.185 2.31e-07 *** pop_dense -2.228e-05 1.051e-04 -0.212 0.832 gini -2.797e+01 6.448e+00 -4.338 1.48e-05 *** income -3.457e-04 2.589e-05 -13.354 < 2e-16 *** value 5.412e-05 3.887e-06 13.924 < 2e-16 *** --- Signif. codes: 0 ‘***’ 0.001 ‘**’ 0.01 ‘*’ 0.05 ‘.’ 0.1 ‘ ’ 1 Residual standard error: 9.376 on 3095 degrees of freedom Multiple R-squared: 0.6252, Adjusted R-squared: 0.6242 F-statistic: 573.8 on 9 and 3095 DF, p-value: < 2.2e-16
Kasey KlimesComment
The Potential of Land Value Tax: Sustainable, Equitable Growth

Introduction

Land is a strange commodity. The economic relationship between taxes and supply is usually very simple; increased taxes are registered by the market as increased cost. Keeping demand constant, increased cost incentivizes less production or lower supply. Tax imports, for example, and imports decrease. Tax retail sales, and people buy less. Tax real estate development, and fewer buildings are built. These taxes are sprinkled across the economy in effort to not over-burden any particular economic lever. However, as Nobel-prize winning economist Joseph Stiglitz notes, “land does not disappear when it is taxed.”[1] Unlike taxes on imports, retail sales, and real estate development, the supply of land remains constant no matter how it is taxed. The ongoing taxation of land merely increases the cost of keeping land unproductive, and therefore increases the supply of land on the market and lowers land prices.

Taxation is more than a simple revenue-generating mechanism­ — it is the most highly developed form of social engineering in the world. With it, we encourage activities we deem socially beneficial, and discourage those that are not. That is, at least, how it works in theory. The traditional design of the property tax’s weighting towards improvements intrinsically inhibits economic growth and poses perhaps the most thorough of threats to the principle of non-distortionary taxation. Ramifications of this problem have manifest as challenges to urban sustainability, economic growth, and wealth equality. Solutions have been posed to redesign the property tax in favor of a tax on land–thereby altering economic incentive and spurring land-efficient development.  Here we will explore the theoretical effects of a land value tax on three types of cities as categorized by their overarching urban planning challenges; sprawled cities like Phoenix or Atlanta, high vacancy cities like Detroit or New Orleans, and growing but highly unequal cities like San Francisco or New York.


A Brief History of Property Tax Predicaments

The property tax in America holds roots in England. When colonial legislatures won the right to levy taxes, the property tax was among the first fiscal instruments on the table.[2] Following the Revolutionary War however, the Articles of Confederation stripped the colonies (then loosely tied nation-states) of their right to this tax. Following the ratification of the United States Constitution, Congress’ first direct tax was an unpopular and short-lived progressive property tax, levied in 1798.[3] The next attempt at a federal property tax was far more successful due to its proposal as a temporary war tax meant to finance the war of 1812.[4] After failing to maintain long-term support on the federal level, however, the property tax rose as an instrument of the state for revenue. In theory it was an equitable means of revenue generation (thus its popularity during this later period), but in practice this was far more complicated due to the difficulty of value assessment and the ease of intangible property tax evasion[5]. State governments would soon abandon the property tax in favor of sales and income taxes. This development shifted responsibility and power from local governments up to the state level[6]. The centralization of government taxation left property taxation as the primary source of revenue to local governments from the Great Depression onward. By the 1990’s, property tax accounted for over 75% of local government revenues.[7]

The history of the property tax is one of abandonment; first by the federal government and later by state governments. What was once thought to be a perfect tax is now considered by many to be the worst. Rather than eliminate the unwanted child of fiscal instrumentation, however, perhaps its design should be reassessed. The property tax in its current (and historical) form poses a series of problems. During the late 1800’s, when states were struggling with their implementation of the property tax, land speculation was rampant in rapidly expanding cities.[8] 

Land speculation is incentivized by property tax structure. Since buildings are taxed heavily according to their assessed value and land is taxed comparably low, it is more profitable to sit on land (incurring only minimal holding costs from taxation) as its value increases than it is to build on the land, which would immediately initiate heavy taxation.[9] Furthermore, since buildings are assessed and taxed according to their quality, property owners are encouraged to neglect their own property in effort to reduce their tax burden. Prior to expansive building and health code overhauls, this was (and in some places continues to be) a contributing factor to the prevalence of urban slums on some of the most valuable land in American cities.[10] Among the primary administrative problems leading to the demise of the property tax at the state level was the difficulty of documenting all tangible and intangible property within an increasingly complex economy. Evasion and fraud is all too easy, and thorough assessment is prohibitively difficult.[11]


A Shifting Solution

In the context of struggles with property tax at the state level, a young social theorist named Henry George wrote Progress and Poverty, addressing the issues surrounding the tax.[12]  He argued that speculators were encouraged to profit from vacant lots at the expense of the surrounding community, whose collective work contributed to the rising value of the speculator’s land. A famous sign erected by one of George’s adherents near a vacant lot describes the resulting dilemma well:

“’Everybody Works But The Vacant Lot’

I paid $3600 for this lot and will hold ‘till I get $6000. The profit is unearned increment made possible by the presence of this community and enterprise of its people. I take the profit without earning it. For the remedy read “HENRY GEORGE”[13]

Henry George

Henry George

George’s solution was straightforward; eliminate taxation on buildings in favor of a tax on the value of land. Land in central cities would be valued highly due to extensive infrastructure and high potential for profitability, while rural land would be assessed and taxed at a much lower level.[14] George argued this to be the only tax that did not “over-burden or discourage production,” was, “easy and cheap to collect,” was restricted from evasion and fell upon citizens equitably.[15] The land value tax would make impossible the profit-snatching game of land speculation, and encourage economic growth by spurring productive and efficient use of land for long term capitalist gains. By releasing land previously held by speculators to those who will actually use it, George believed employment would be created and poverty diminished[16]. This tax further addresses the problems states ran into with property tax: land value is more easily assessed than buildings and personal property, and virtually impossible for holders to conceal — as some contemporary proponents have pointed out, land owners “can’t stash it in a secret Panamanian bank account.”[17]

The problems faced with property tax by the federal and state governments throughout American history have been almost entirely due to the more specific taxation on buildings and intangible property partnered with the curious void of taxation on land. Hidden beneath this has been the possibility of a tax that boosts economies while simultaneously generating higher revenues. By taxing a communally created value (land), governments earn revenue based on the betterment of their counties, cities, and neighborhoods.[18] This betterment leads to higher land values and thus higher revenues that can then be reinvested in the community, leading again to higher revenues. In this way, land value tax triggers a self-perpetuating chain reaction of economic growth. Land value taxation allows a community to reap the benefits of its own labor. While sales taxes are regressive and income taxes arguably discourage work due to the structure of tax brackets, the land value tax is equitable, non-distortionary, and inelastic[19].
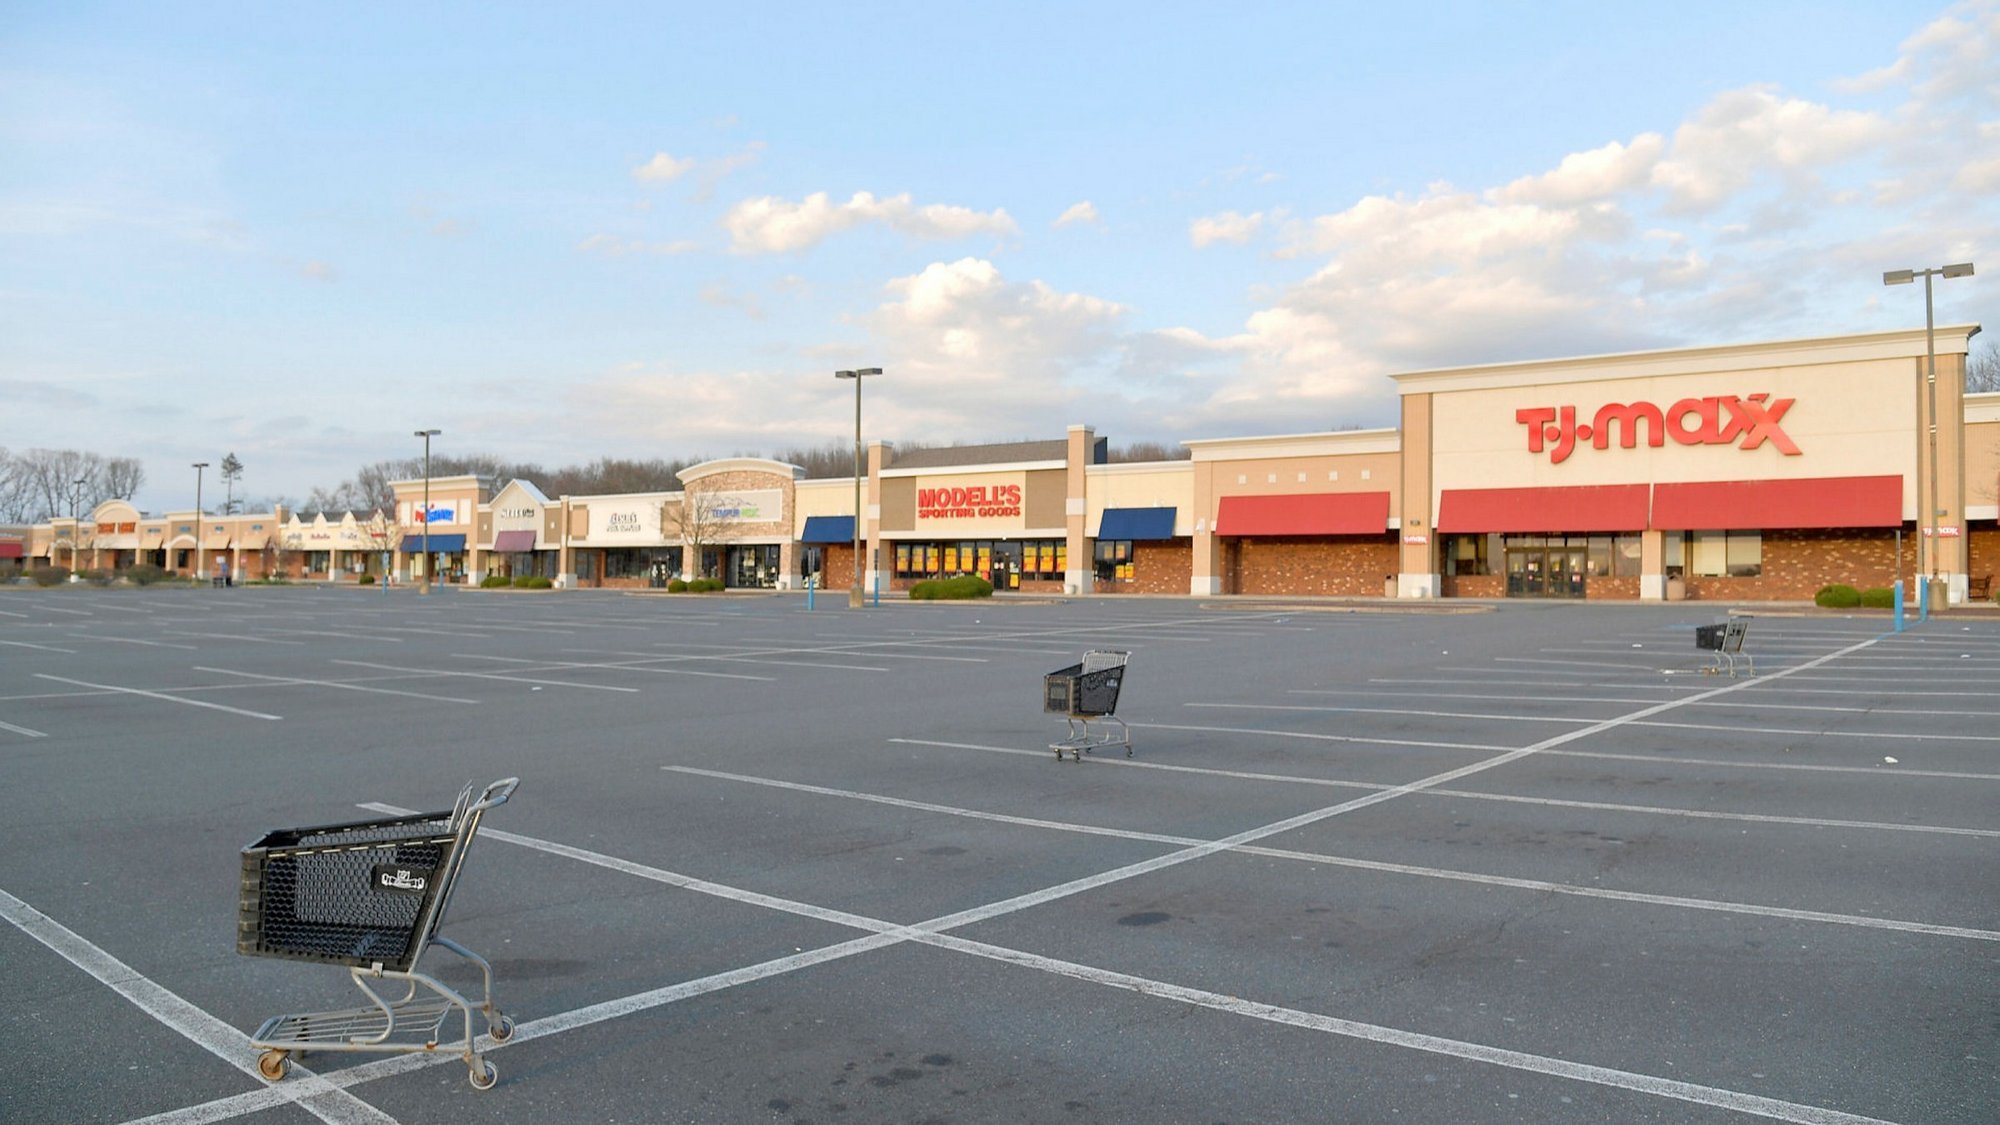
 

Sprawl

Kunstler translates George’s economic problem into the framework of an urban ecosystem:

"Our system of property taxes punishes anyone who puts up a decent building made of durable materials. It rewards those who let existing buildings go to hell. It favors speculators who sit on vacant or underutilized land in the hearts of our cities and towns. In doing so it creates an artificial scarcity of land on the free market, which drives up the price of land in general, and encourages ever more scattered development, i.e., suburban sprawl."[20]

The intangible realm of economics has a startling correlation with the most concretely physical aspects of society: our built environments. Land speculation punches unsightly holes in the urban fabric of cities and flings development further outward. The very existence of cities supports agglomeration theory–that there is economic advantage in closeness. So why does Phoenix (among other US cities) look like it was built to keep everyone and everything as far apart as possible?

Henry George did not live to witness the epidemic of sprawl in America, but due to it his theories are more relevant than ever. Mary Rawson of the Urban Land Institute asserts that, “The sprawl problem is almost purely the result of land speculation at work,” and that land value taxation would create, “pressures tending toward the efficiency of development” by taxing land speculators based on the potential earning power of their property.[21] This relationship is partially due to the physical barrier to density posed by vacant lots, but perhaps even more so by the high land prices speculators create. By restricting so much land from the open market, speculators create an artificial scarcity of land that drives up surrounding prices and pushes development further out in effort to find affordable land.[22]

Residential density is heavily discouraged under current property tax structure. High density makes communities walkable, public transportation effective, and automobile use optional.[23] It is important to note that the land value tax not only spurs development, but more specifically that it spurs dense development. In theory, it would cause sprawl to contract by incentivizing development in the most dense urban areas and disincentivizing development on the exurban fringe.  Urban planners and city politicians struggling to combat sprawl tend to jump to coercive measures with mixed results (Portland, Oregon’s urban growth boundary is among the more successful examples, but even Portland struggles to combat sprawl within the boundary)[24].

Considering the incentive to sprawl due to property tax structure, these measures are akin to herding cats in an aviary as opposed to placing a bowl of catnip in the center.  This approach ignores the artificially constructed enticements to sprawl, the fundamental root of the problem. The field of urban planning and governance often attempts to combat behavior with restrictions as opposed to merely eliminating distortions in tax structure to incentivize positive behavior – in this case, compact development.


Vacancy

Cities like Detroit, New Orleans, and St. Louis have been caught in a vicious cycle. The loss of industry has led to economic decline, which results in vacancy, which leads to reduced public funds, high crime, and less investment, all of which leads to further economic decline. High vacancy rates are the both the physical result of economic decline as well as a primary cause of economic decline. In many cities, especially in the rust belt, landowners may not be incentivized to speculate within a booming market but the cost of holding land vacant remains negligible.

Meanwhile many of these cities have increased property taxes as much as possible in attempt to maintain the public budget in the face of population loss.[25] The highest local tax rates in the country tend to belong to shrinking cities in and around the rust belt: Detroit, Milwaukee, Columbus, and Baltimore all fall within the top ten most taxed cities in the nation.[26] These cities rely most heavily on property tax. In other words, the cost of building has increased, further disincentivizing development in the places that need it most.

A revenue-neutral shift from taxes on buildings to taxes on land would put the highest development pressures on the vacant parcels (and surface parking lots) in the urban cores of these cities.


Inequality

Wealth inequality is perhaps the primary driver of land value tax considerations today, especially given the dramatic affordable housing crisis happening in wealthy coastal cities. Proponents of land value tax argue that shifting tax weight from buildings to land will significantly lower the price of land and housing.[27] By this logic, land value tax would spur owners of under-developed land to either (A) build housing in order to cover their increased holding costs or (B) sell their land to someone who will. Together, these actions would increase the supply of both housing and land, thereby reducing the price of housing and the acquisition cost of land. This could have considerable effects on the supply of affordable housing in dense urban areas, but it also redistributes wealth disparities.

As Amit Ghosh, former San Francisco Chief of Comprehensive Planning, points out, the lowering of development costs via land value taxation opens the door to sizable expansions in inclusionary housing policies. San Francisco’s current affordable housing requirements of 12% to 20% (depending on if the housing is provided on or off-site) could be plausibly increased to as much as 60% with dramatically lower land prices.[28]

Matthew Rognlie of MIT recently identified that housing capital explains nearly all capital value growth in the United States over the last 50 years. More specifically, the increasing value has been in the location of housing—in other words, in land value.[29] This finding suggests that the un-taxed value of land is the primary driver of growing wealth inequality.

Central to the theory of land value taxation is a basic principle of fairness. If a property owner in San Francisco lucked out in buying prior to the recent real estate boom, the value of their property assets have increased dramatically despite no productive action on the property owner’s part. This value gain is an unearned increment, and deeply exacerbates the stratification of wealth in the city. A tax on land (the logistical hurdles of California’s Prop 13 notwithstanding) could correct this imbalance.


Pennsylvania: A Case Study

Despite its occasional proposal in the realm of economic discourse and policy analysis for urban sustainability, the land value tax has yet to be fully implemented in any American city. The solution was briefly posed for increasing energy consumption by the House Committee on Banking, Finance, and Urban Affairs of the 96th Congress in the early 1980’s, but received little further attention.[30] In search of concrete evidence to uphold the theories of land value tax proponents, there are a handful of case studies to be made. The closest model of land value tax implementation in the US today is the split-rate style property tax imposed in a number of Pennsylvania cities and townships, the most notable being Pittsburgh and Harrisburg. As of 1996, the land-to-building tax ratio for Pittsburgh and Harrisburg was 5.61:1 and 4:1, respectively[31]. Following Pittsburgh’s implementation of the split-rate tax in the late 1970’s, building permits issued in the city increased 293% over the national average[32]. When comparing the change in average annual value of building permits between the 1960’s and 1980’s, the value of Pittsburgh’s building permits far exceeded those of similarly sized cities in the region. The average building permit in the cities studied by the University of Maryland in 1992 (all of which possessed a single-rate property tax structure) lost about 29.9% of its value over this period. In contrast, Pittsburgh’s average building permit increased by 70.4% in value.[33] Harrisburg, which began its split-rate property tax in the mid 70’s, saw the number of vacant structures within the city plummet from 4,200 in 1982 to less than 500 by the late 90’s.[34] The mayor of Harrisburg attributed much of the city’s economic strength in that period to its innovative property tax solutions.[35]

Despite the cascade of well-documented success, Pittsburgh removed its split-rate property tax system in 2000 following public disapproval due to higher reassessed values causing taxes to increase. Though this is actually a positive indicator of the split-tax rate’s achievement, the true irony of the situation was revealed in the aftermath; most homeowners and business owners ultimately paid higher taxes following the rescission[36]. Construction spending during the two years following rescission was 21% lower than during the two years prior, even while average construction activity for the nation increased.[37] It is difficult to determine the exact degree of impact the split-rate tax system had on these variables in Pittsburgh, but most factors suggest a strong relationship between the ratio of land to building tax and the rate of compact development. International examples of land value taxation exist in South Africa, Denmark, New Zealand, and Australia, all of whom have experienced varying degrees of similar results.[38]


Land Value Tax in Political Context

The mainstream dialogue over taxation has hinged primarily on a one dimensional spectrum: Should taxes be lower or higher? While pundits and politicians holler from their respective corners, the fundamental question over the point of taxation finds little room on the table. Some argue that the point of taxation does not matter, as money is taken from the economy at large regardless. Henry George counters this assault, writing that, “The mode of taxation is, in fact, quite as important as the amount. As a small burden badly placed may distress a horse that could carry with ease a much larger one properly adjusted, so a people may be impoverished and their power of producing wealth destroyed by taxation, which, if levied in another way, could be borne with ease.”[39] 

It could be argued that the land value tax transcends the ideological polarity of our time; it fits neatly into the intellectual framework of both major political parties without giving in to either party’s tendency towards higher or lower taxes. The theoretical grounds of the land value tax have been supported right-leaning organizations,[40] while its results have been heralded by those on the left pushing for progressive policies. In his day, George was labeled both a libertarian and a socialist, though both characterizations failed to grasp the core pragmatism of his proposal.[41] Given the acceptance found across the political spectrum and the potential economic growth induced by a revenue-neutral shift, the lack of consideration at the municipal or even federal level can only be explained by the entrenched power of large landowners.

Due to the 1865 court decision of Clark v. City of Des Moines, most municipal governments are restricted from property tax reforms unless consented by their superior state government (this ruling would later be known as “Dillon’s Rule”).[42] In Pennsylvania, reform came about purely under the permission of the state. The state legislature authorized Pittsburgh and Scranton to redesign tax structure in 1913, and numerous smaller cities in 1951.[43] As a number cities are learning as they push towards property tax reform, municipal changes of this magnitude require pressure at the state level. Clearly this creates an administrative tension: if a revenue source is administered, collected, and utilized entirely at the local level, should the right to alter corresponding legislation be held at the state level? This dilemma can be applied to a myriad of issues, but given the degree at which local governments rest on property tax it is a fundamental question in this arena.

State constitutions and statutes would generally require amendment to allow for land value taxation. Initial roadblocks include common clauses commanding taxes be applied identically to all taxpayers – a provision potentially at odds with land value taxation due to the possibility of two parcels with the same overall value but different land values.[44] Amendment solutions range from differential classification under tax law for land and buildings to the total exemption of improvements from taxation. Though logistical concerns have been raised in the past, the technological development of assessment methods has improved greatly due to geographic information systems and computer-assisted mass appraisal.[45] The precision of assessment necessitated by land value taxation can now be conducted in an efficient and effective manner, but political obstruction remains.

Should reforms be reached at the state level (perhaps as an assisting tool to ailing local economies and state budget shortfalls), a more widespread analysis of effectual change could lead to policy review at the federal level. As has occurred on numerous occasions in American history, experimentation at the state level can lead quickly to national reform. The artificial devaluing of land may be a contributing determinant to the violence of economic swings — should the land value tax reach the national stage’s discourse, it could very well receive swift implementation.


Conclusion

Far from the headlines of news cables and beneath the layers of public policy discourse rests a pragmatic strategy that could potentially overhaul the fundamentals of local economies towards efficiency, stability, and sustainable productivity. While it rarely sees the daylight of discussion in town hall meetings or congressional hearings, the ramifications of land value taxation have been analyzed and dissected for over a century. The problems potentially solved are vast, but all stem from a single root — land has become a devalued commodity.

Should land be reassigned its value by our economic systems, it follows naturally that market incentives should ignite a swing towards geo-efficient and socially-just development. In cities with excessive sprawl, the land value tax should be considered as a component in the strategy to curb greenfield development. In cities with high vacancy and weak economies, the land value tax should be considered as a component in the strategy to encourage urban infill and incite economic activity. In the booming but vastly inequitable economies of large coastal cities, the land value tax should be considered as a strategy for providing more affordable housing and correcting the imbalance of severe wealth inequality. The question then, is which major city is willing to experiment first?


Footnotes

[1] Stevens, Elizabeth Lesly. 2011. “A Tax Policy With San Francisco Roots.” The New York Times, July 30. http://www.nytimes.com/2011/07/31/us/31bcstevens.html.

[2] Glenn Fisher, The Worst Tax?: A History of The Property Tax in America (Lawrence, KS: University of Kansas Press, 1996), 7.

[3] Glenn Fisher, "Some lessons from the history of the property tax. (Cover story)." Assessment Journal 4, no. 3 (May 1997): 40.

[4] Ibid.

[5] Ibid.

[6] Fisher, The Worst Tax?: A History of The Property Tax in America, 207.

[7] Ibid., 4.

[8] Fisher, "Some lessons from the history of the property tax. (Cover story)," 40.

[9] James Howard Kunstler, Home From Nowhere (New York: Simon & Schuster, 1996), 197.

[10] Ibid., 198.

[11] Fisher, "Some lessons from the history of the property tax. (Cover story)," 40.

[12] Mark Blaug, "Henry George: rebel with a cause." European Journal of the History of Economic Thought 7, no. 2 (Summer2000 2000): 270-288.

[13] Henry George, "Everybody Works But The Vacant Lot," NYPL Digital Gallery, http://digitalgallery.nypl.org/nypldigital/id?1160280

[14] Kunstler, Home From Nowhere, 201.

[15] Barbara Goodwin, "Taxation in Utopia." Utopian Studies 19, no. 2 (June 2008): 315.

[16] Aaron M Sakolski, Land Tenure and Land Taxation in America (New York: Robert Shalkenbach Foundation, Inc., 1957), 276.

[17] Kunstler, Home From Nowhere, 202.

[18] Ibid., 197.

[19] Joseph H Haslag, How to Replace the Earnings Tax in St. Louis, Policy Study 5, http://showmeinstitute.org/docLib/20070411_smi_study_5.pdf

[20] Kunstler, Home From Nowhere, 196-197.

[21] Urban Land Institute, Property Taxation and Urban Development, ed. Mary Rawson, Research Monograph 4 (Washington, DC: Urban Land Institute, 1961), 26-27.

[22] Ibid., 28.

[23] Center for Neighborhood Technology, Pennywise, Pound Fuelish: New Measure of Housing and Transportation Affordability, 8.

[24] Metro Regional Government, Metro, http://www.metro-region.org/

[25] Margolis, Jason. 2015. “On The Road To Recovery, Detroit’s Property Taxes Aren’t Helping.” NPR.org. http://www.npr.org/2015/05/27/410019293/on-the-road-to-recovery-detroit-property-taxes-arent-helping.

[26] “Top 10 Cities with the Highest Tax Rates.” 2015. USA TODAY. http://www.usatoday.com/story/money/personalfinance/2014/02/16/top-10-cities-with-highest-tax-rates/5513981/.

[27] Kunstler, Home From Nowhere, 200.

[28] Ghosh, Amit. "Understanding Land Value." Lecture, UC Berkeley Department of City and Regional Planning, Berkeley, CA, November 16, 2015.

[29] Rognlie, Matthew. "A note on Piketty and diminishing returns to capital." Tillgänglig:< http://www. mit. edu/~ mrognlie/piketty_diminishing_returns. pdf (2014).

[30] House Committee on Banking, Finance, and Urban Affairs, Subcommittee of the City. Compact Cities: Energy Saving Strategies for the Eighties. Report. 96th Congress, 2nd Session. 1980. 8 p. Committee Print 96-15.

[31] Wallace Oates and Robert Schwab, "The Impact of Urban Land Taxes: The Pittsburgh Experience," National Tax Journal L1 (March 1997): 2.

[32] Kunstler, Home From Nowhere, 204-205.

[33] Wallace Oates, Robert Schwab, and Universty of Maryland, Urban Land Taxation for the Economic Rejuvenation of Center Cities: The Pittsburgh Experience (Columbia, MD: Center for the Study of Economics, 1992).

[34] Alanna Hartzok, "Pennsylvania's Success With Local Property Tax Reform: The Split Rate Tax." American Journal of Economics & Sociology 56, no. 2 (April 1997): 205-213.

[35] Edward J. Dodson, “Saving Communities: It Matters How Government Raises Its Revenue” (powerpoint presentation, March 2010) 27.

[36] Ibid., 21.

[37] Ibid., 22.

[38] Richard F Dye, Richard W England, and Lincoln Institute of Land Policy, Assessing the Theory and Practice of Land Value Taxation, Policy Focus Report, 16,

https://www.lincolninst.edu/pubs/dl/1760_983_Assessing%20the%20Theory%20and%20Practice%20of%20Land%20Value%20Taxation.pdf

[39] Henry George, Progress and Poverty (1879; New York: Robert Schalkenbach Foundation, 1981), 409.

[40] Haslag, How to Replace the Earnings Tax in St. Louis, Policy Study 5.

[41] Goodwin, “Taxation in Utopia”, 315.

[42] Jesse J Richardson, Meghan Zimmerman Gough, and Robert Puentes, Is Home Rule The Answer?: Clarifying the Influence of Dillon's Rule on Growth Management , 8, http://www.brookings.edu/~/media/Files/rc/reports/2003/01metropolitanpolicy_jesse%20j%20%20richardson%20%20jr/dillonsrule.pdf

[43] Dye, England, Lincoln Institute of Land Policy, Assessing the Theory and Practice of Land Value Taxation, 13.

[44] Ibid., 24.

[45] Ibid., 25.


References

Beck, Hanno T. "Land Value Taxation and Ecological Tax Reform." Land-Value Taxation: The Equitable and Efficient Source of Public Finance (1999). http://www.taxpolicy.com/etrbeck.htm#notes

Blaug, Mark. "Henry George: rebel with a cause." European Journal of the History of Economic Thought 7, no. 2 (Summer 2000): 270-288.

Center for Neighborhood Technology. Pennywise, Pound Fuelish: New Measure of Housing and Transportation Affordability. http://www.cnt.org/repository/pwpf.pdf

Dodson, Edward J. “Saving Communities: It Matters How Government Raises Its Revenue.” Presentation, March 2010.  http://www.authorstream.com/Presentation/ejdodson-349627-saving-communities-narrated-march-2010-taxation-economic-development-business-finance-ppt-powerpoint/

Dye, Richard F, Richard W England, and Lincoln Institute of Land Policy. Assessing the Theory and Practice of Land Value Taxation. Policy Focus Report. https://www.lincolninst.edu/pubs/dl/1760_983_Assessing%20the%20Theory%20and%20Practice%20of%20Land%20Value%20Taxation.pdf

Fisher, Glenn W. "Some lessons from the history of the property tax. (Cover story)." Assessment Journal 4, no. 3 (May 1997): 40.

Fisher, Glenn. The Worst Tax?: A History of The Property Tax in America. Lawrence, KS: University of Kansas Press, 1996.

George, Henry. "Everybody Works But The Vacant Lot." NYPL Digital Gallery. http://digitalgallery.nypl.org/nypldigital/id?1160280

George, Henry. Progress and Poverty. 1879; New York: Robert Schalkenbach Foundation,  

Ghosh, Amit. "Understanding Land Value." Lecture, UC Berkeley Department of City and Regional Planning, Berkeley, CA, November 16, 2015.

Goodwin, Barbara. "Taxation in Utopia." Utopian Studies 19, no. 2 (June 2008): 313-     331.

Hartzok, Alanna. "Pennsylvania's Success With Local Property Tax Reform: The Split Rate Tax." American Journal of Economics & Sociology 56, no. 2 (April 1997):   205-213.

Haslag, Joseph H. How to Replace the Earnings Tax in St. Louis. Policy Study 5. http://showmeinstitute.org/docLib/20070411_smi_study_5.pdf

Kenworthy, J R, and F B Laube. ) An International Sourcebook of Automobile   Dependence in Cities, 1960-1990. Boulder, CO: University Press of Colorado,                   1999.

Kunstler, James Howard. Home From Nowhere. New York: Simon & Schuster, 1996.

Longman, Phillip J. "Who Pays For Sprawl?" US News and World Report, April 19,          1998. http://www.usnews.com/usnews/news/articles/980427/archive_003780.htm

Margolis, Jason. 2015. “On The Road To Recovery, Detroit’s Property Taxes Aren’t Helping.” NPR.orghttp://www.npr.org/2015/05/27/410019293/on-the-road-to-recovery-detroit-property-taxes-arent-helping.

Metro Regional Government. Metro. http://www.metro-region.org/

Oates, Wallace, and Robert Schwab. "The Impact of Urban Land Taxes: The Pittsburgh Experience." National Tax Journal L1 (March 1997): 2.

Oates, Wallace, Robert Schwab, University of Maryland. Urban Land Taxation for the Economic Rejuvenation of Center Cities: The Pittsburgh Experience. Columbia, MD: Center for the Study of Economics, 1992.

Richardson, Jesse J, Meghan Zimmerman Gough, and Robert Puentes. Is Home Rule The Answer?: Clarifying the Influence of Dillon's Rule on Growth Management. http://www.brookings.edu/~/media/Files/rc/reports/2003/01metropolitanpolicy_jesse%20j%20%20richardson%20%20jr/dillonsrule.pdf

Sakolski, Aaron M. Land Tenure and Land Taxation in America. New York: Robert Shalkenbach Foundation, Inc., 1957.

Sierra Club. Sprawl Costs Us All: How Your Taxes Fuel Suburban Sprawl. Edited by Nicholas L. Cain, 2000. http://www.sierraclub.org/sprawl/report00/sprawl.pdf

Stevens, Elizabeth Lesly. 2011. “A Tax Policy With San Francisco Roots.” The New York Times, July 30. http://www.nytimes.com/2011/07/31/us/31bcstevens.html.

“Top 10 Cities with the Highest Tax Rates.” 2015. USA TODAY. http://www.usatoday.com/story/money/personalfinance/2014/02/16/top-10-cities-with-highest-tax-rates/5513981/.

 Urban Land Institute. Property Taxation and Urban Development. Edited by Mary Rawson. Research Monograph 4. Washington, DC: Urban Land Institute, 1961.

Williams, Karl. "Land Value Taxation: The Overlooked but Vital Eco-Tax." Cooperative Individualism. http://www.cooperativeindividualism.org/williams_lvt_overlooked_ecotax.html

Zhao, Zhenxiang, and Robert Kaestner. "Effects of urban sprawl on obesity." Journal of Health Economics 29, no. 6 (December 2010): 779-787.

Kasey KlimesComment